
Global equities were able to withstand several headwinds in 3Q26 to finish the quarter in positive territory and in some cases, even near record highs (e.g., S&P 500, Nasdaq). Equity investors shook off the first Fed rate hike since 2023, sovereign bond yields surging to multi-decade highs, a September sell-off in global stocks, the relentless upward pressure on oil prices and inflation proving to be sticky. Instead, earnings took center stage with S&P 500 earnings hitting a record high and analysts upgrading future quarterly estimates.
LISTEN NOW: Alternate View Podcast
As we move to close out 2026, the economic expansion is expected to continue with AI capex spending to be the major source of growth. While consumers face mounting cost pressures, the labor market has not deteriorated. Plus unemployment remains low, so we expect consumers to contribute to growth, albeit at a slower pace. Global equities are likely to finish 2026 higher for the fourth consecutive year.
However, we caution investors that concentration risk is real, earnings expectations leave little room for error, and AI debt fears are emerging. As a result, any disappointment in earnings and/or economic growth can lead to heightened volatility and broader market losses. In addition, the global bond sell-off and prolonged war with Iran should not be ignored as this can dampen overall risk sentiment and is raising the cost of capital. In this quarterly outlook, we offer our view on the economy and asset classes as we move into year end.
Global Economy – AI Capex Spend to Continue to Support Growth
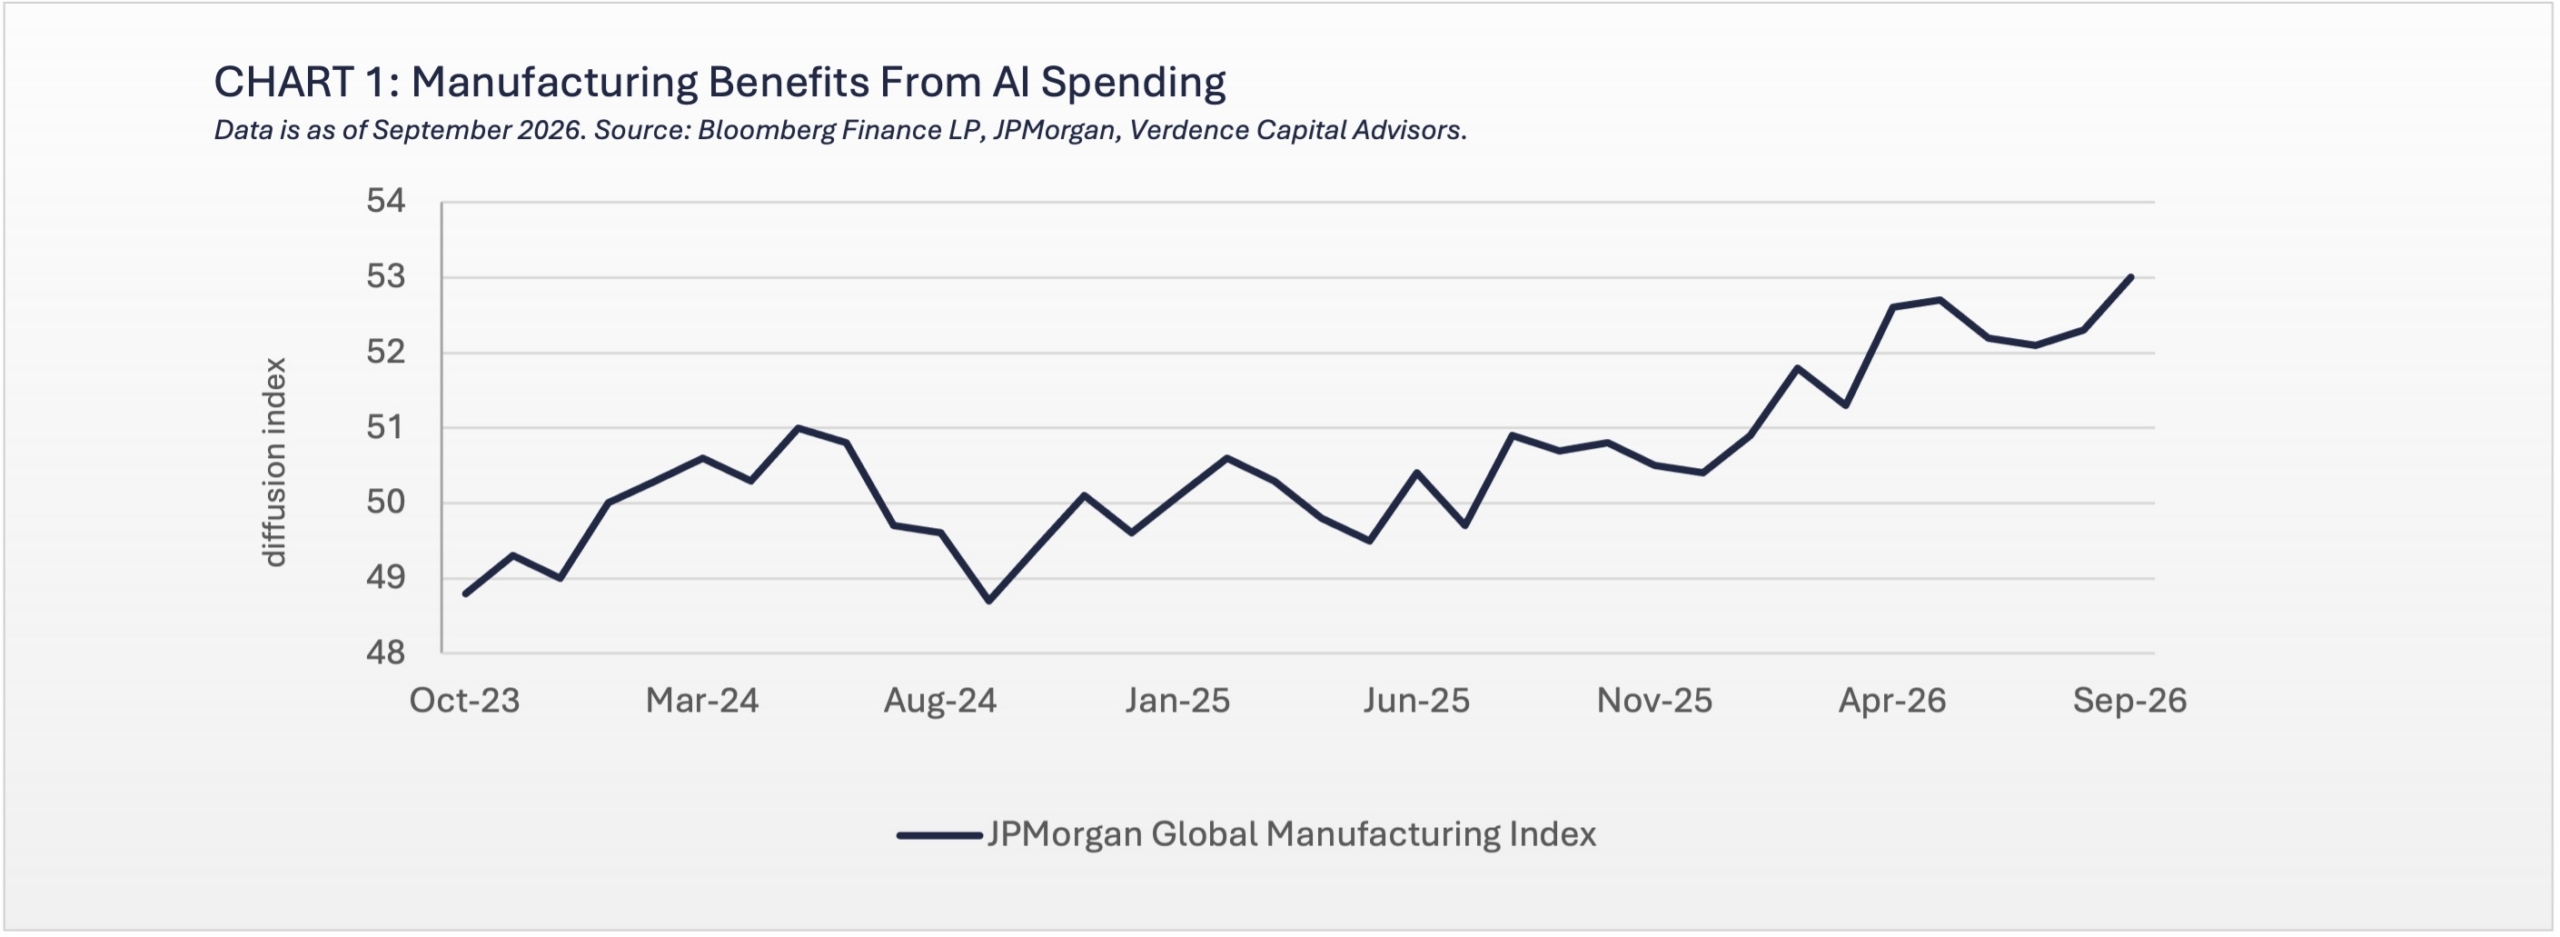
The global economy has been resilient in the face of a major energy shock, prolonged war in the Middle East, renewed inflationary pressures, and higher interest rates. Global manufacturing is benefiting from the boom in AI capex spending (chart 1). The ongoing geopolitical instability has resulted in a surge in government spending on defense.
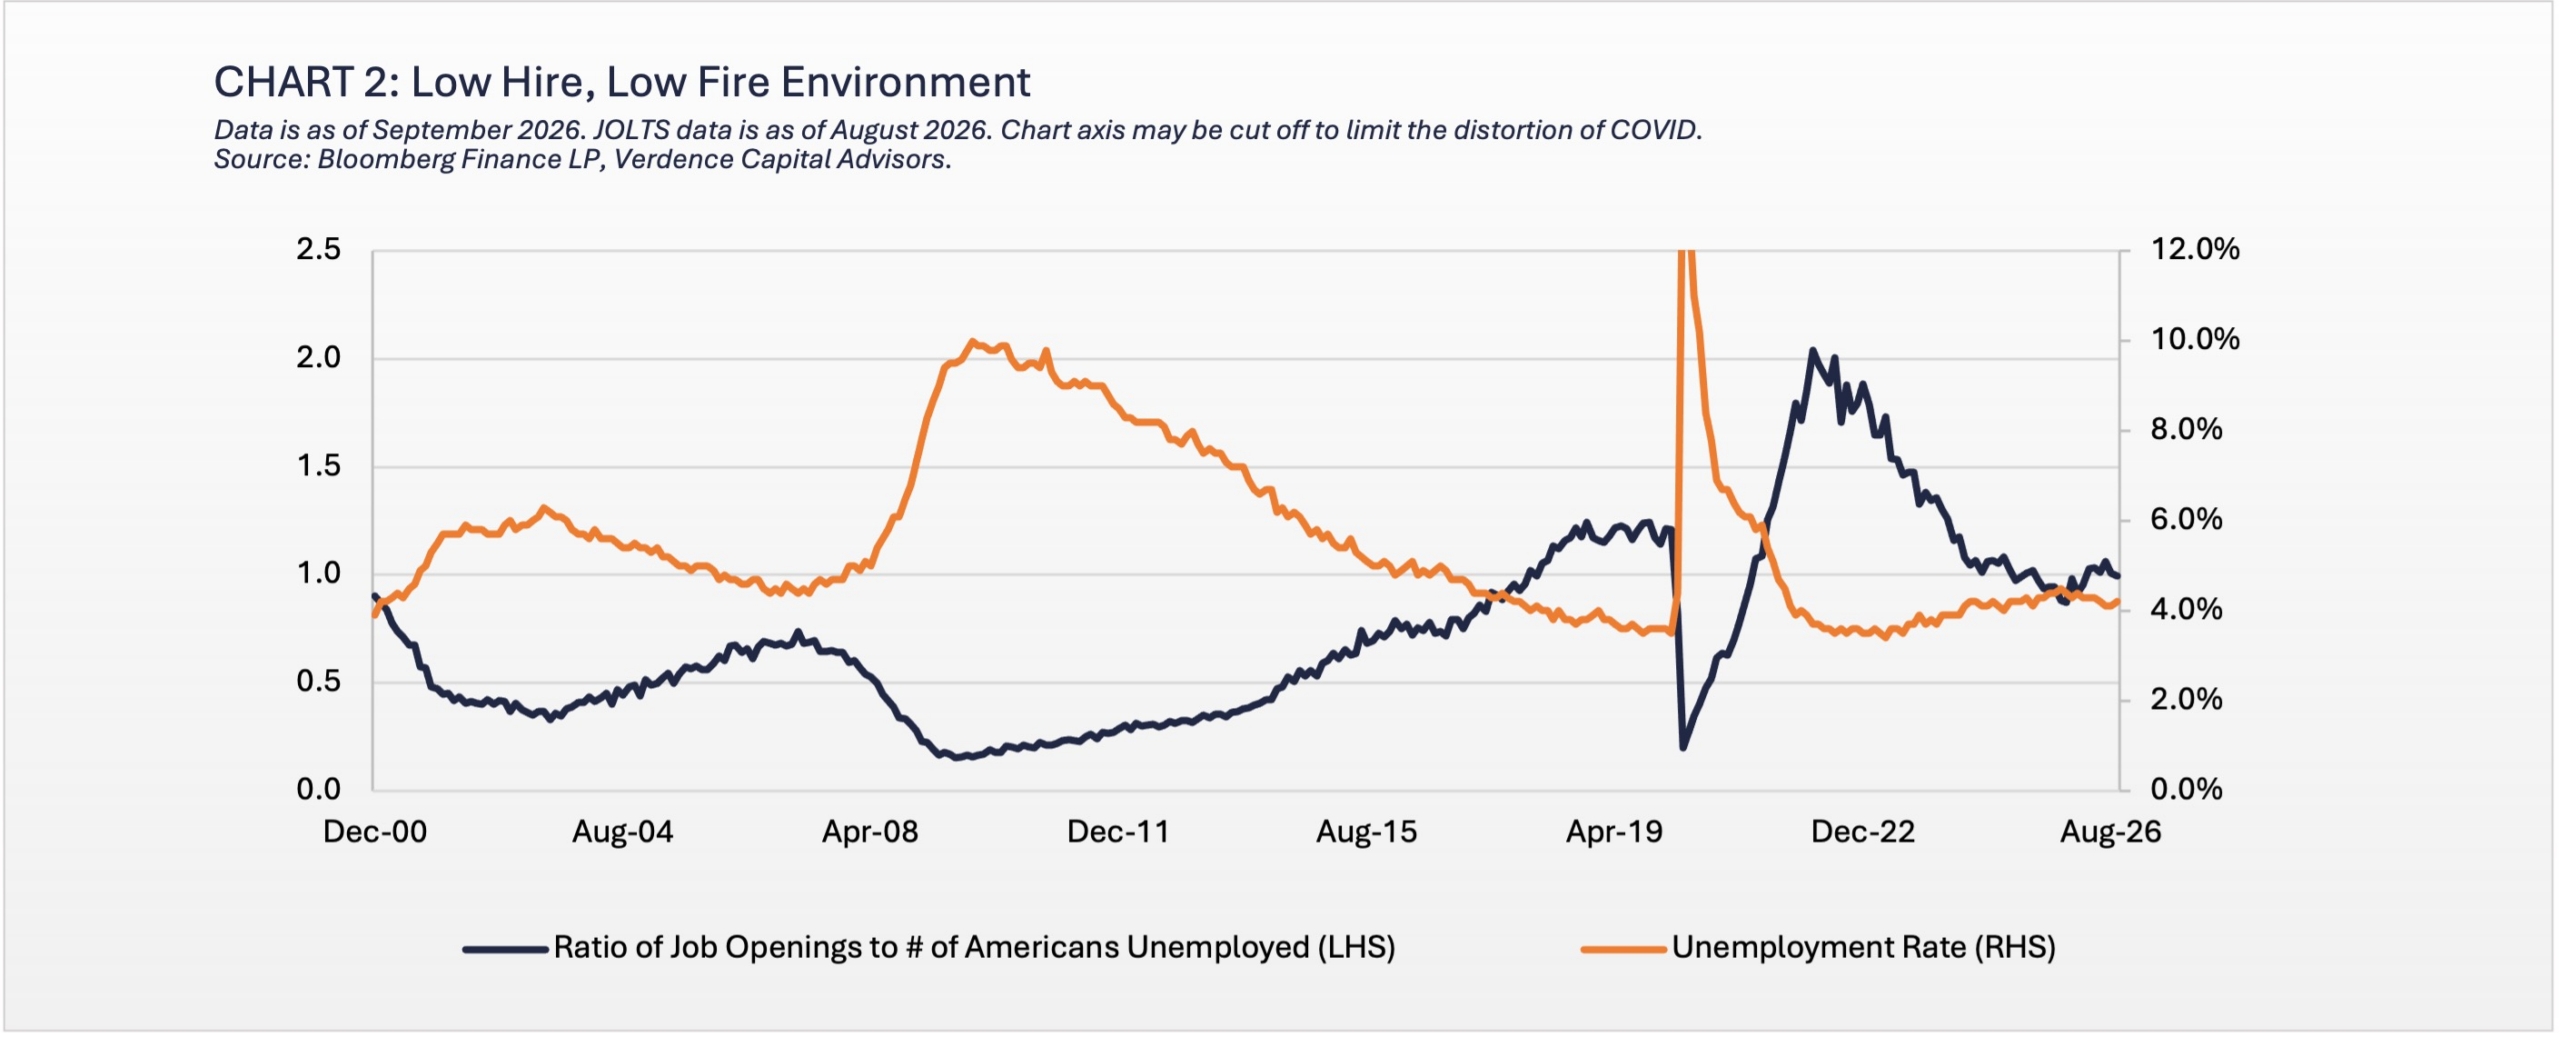
This, in turn, has boosted local economic growth (e.g., Germany). In addition, U.S. households continue to spend as the labor market has slowed. But the “low hire, low fire” environment has kept the unemployment rate near historical lows (chart 2).
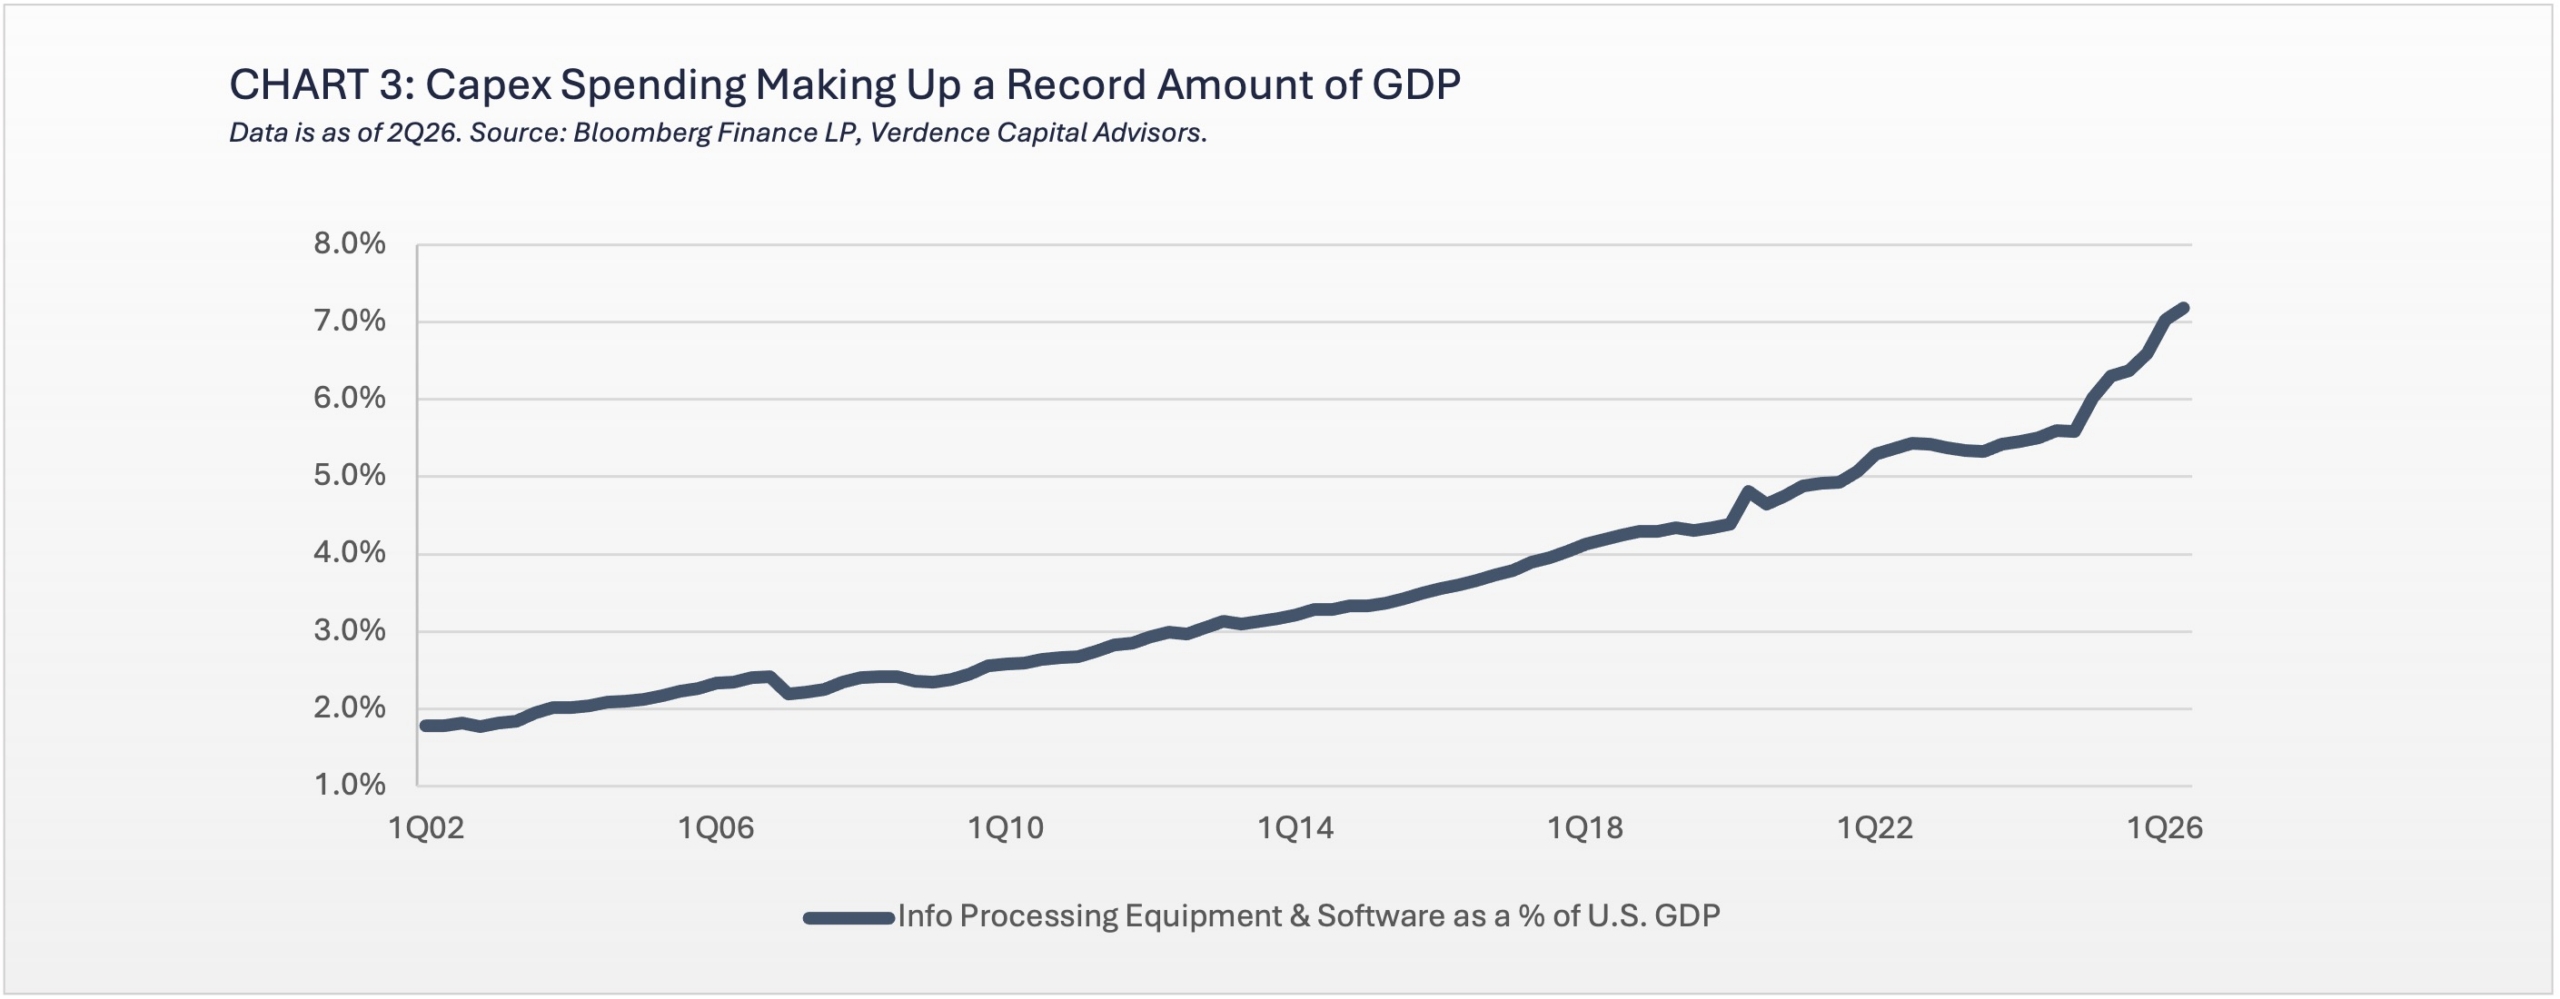
Within the U.S., economic growth is likely to be reliant on capex spending as we expect the contribution from the consumer to slow in the coming quarters. Capex spending (measured by spending on information processing equipment and software) is making up the largest percentage of GDP on record (chart 3). If you excluded those two primary AI spending categories, the median average year-over-year GDP growth over the past eight quarters would be ~1% less than the headline number.
Given that there is no expectation for this spending to slow imminently, we expect economic growth to remain steady in the coming quarters. Goldman Sachs expects AI investment to reach $1 trillion globally in 2026 (~0.9% of global GDP), which also aids technology-exporting countries (e.g., Korea, Taiwan).
Consumers Are Feeling the Strain
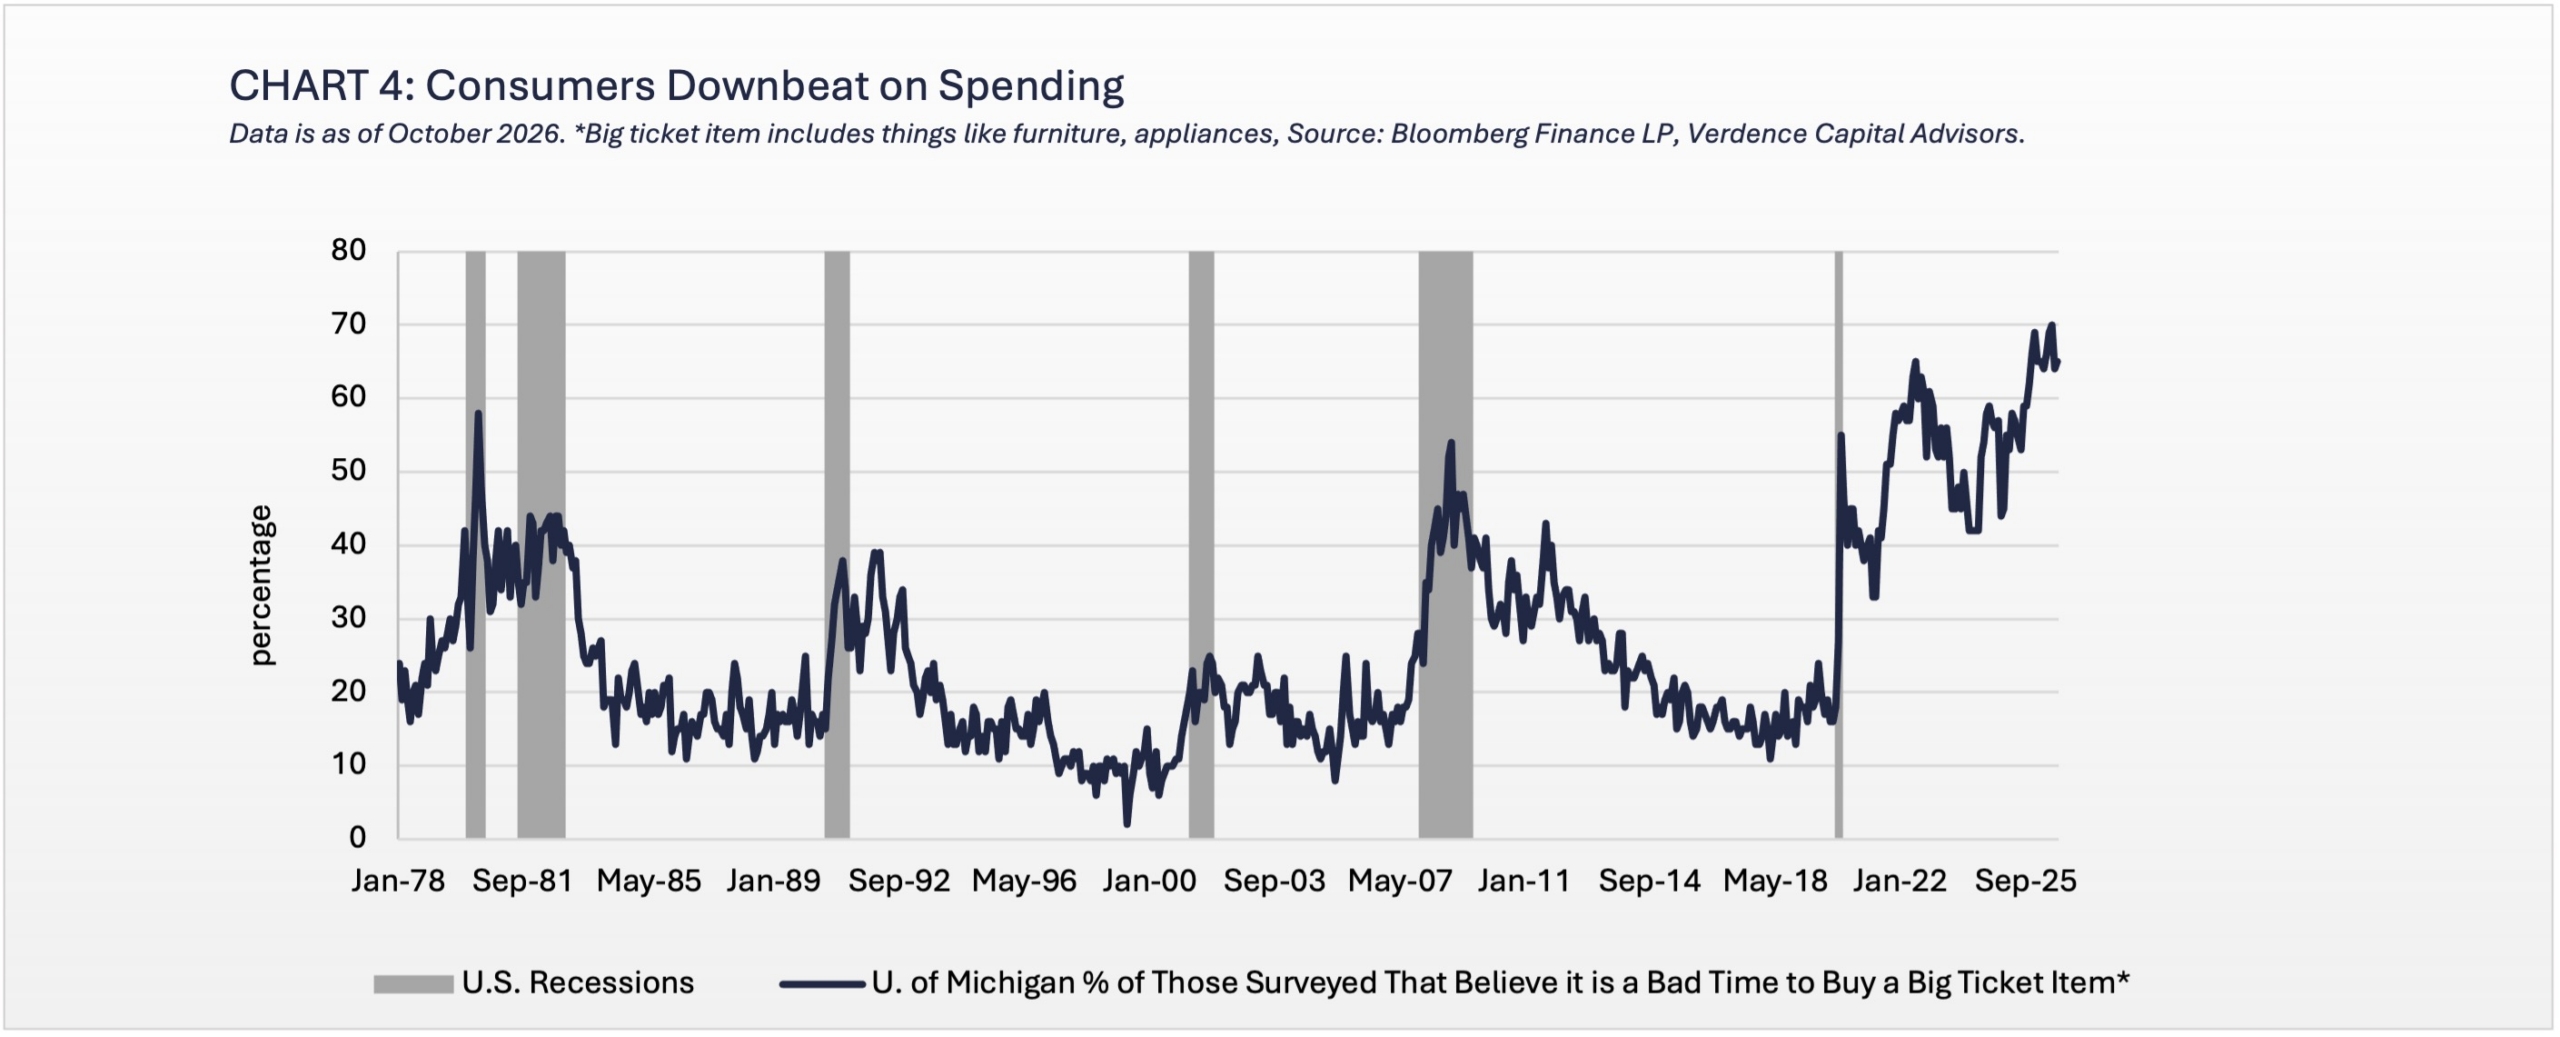
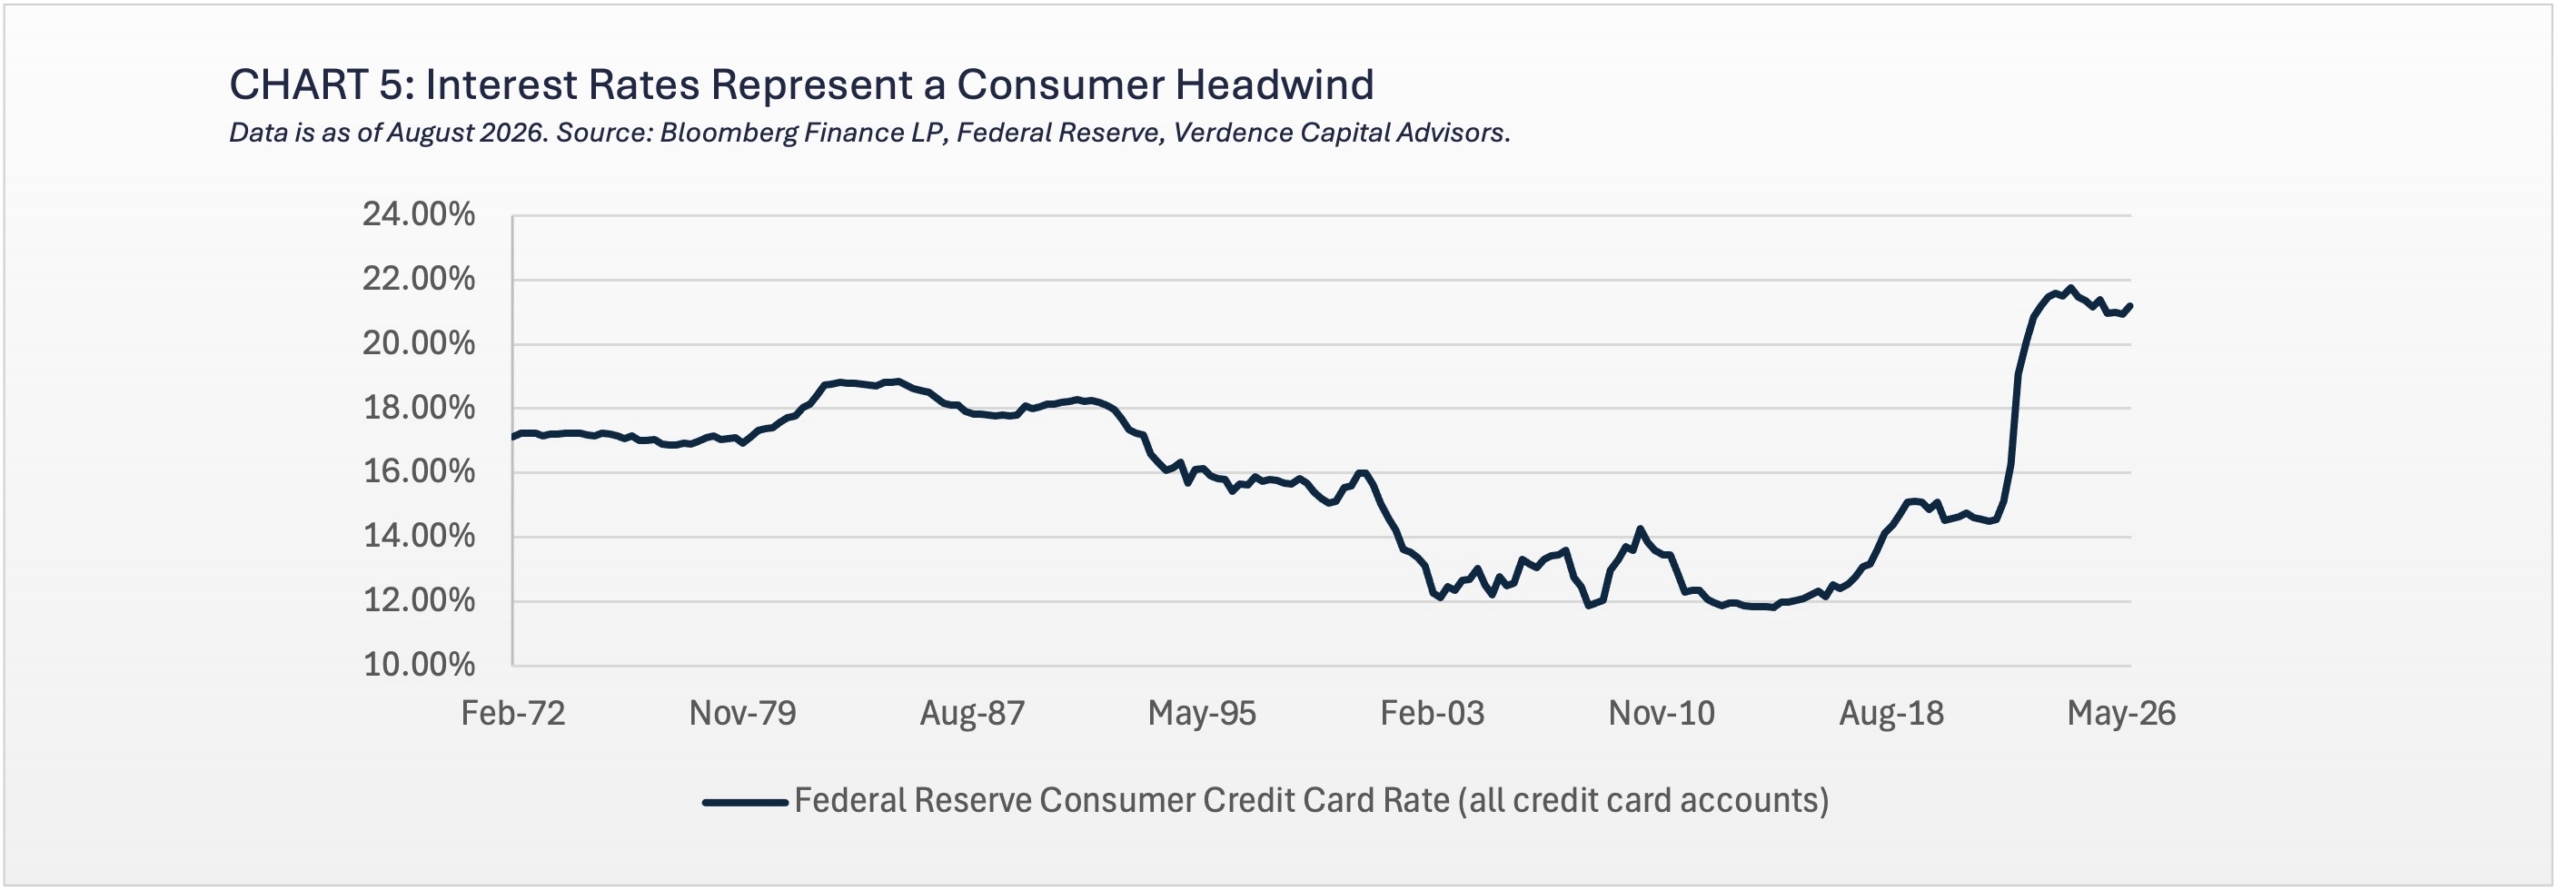
We admit the consumer has been more resilient than we had anticipated in 2026. That’s due to spending holding up even as the University of Michigan’s Consumer Confidence survey shows households increasingly view this as a bad time to buy big ticket items (e.g., furniture, appliances) (chart 4). The combination of more than five years of elevated inflation, surging energy costs, negative real wages and higher interest rates is likely to weigh on spending at some point. The timing of this slowdown is difficult to predict, but with the personal savings rate historically low, real wages declining on a year-over-year basis for the past six consecutive months and credit card rates near a record high (chart 5), consumers are facing many headwinds.
Housing Remains in a Downturn
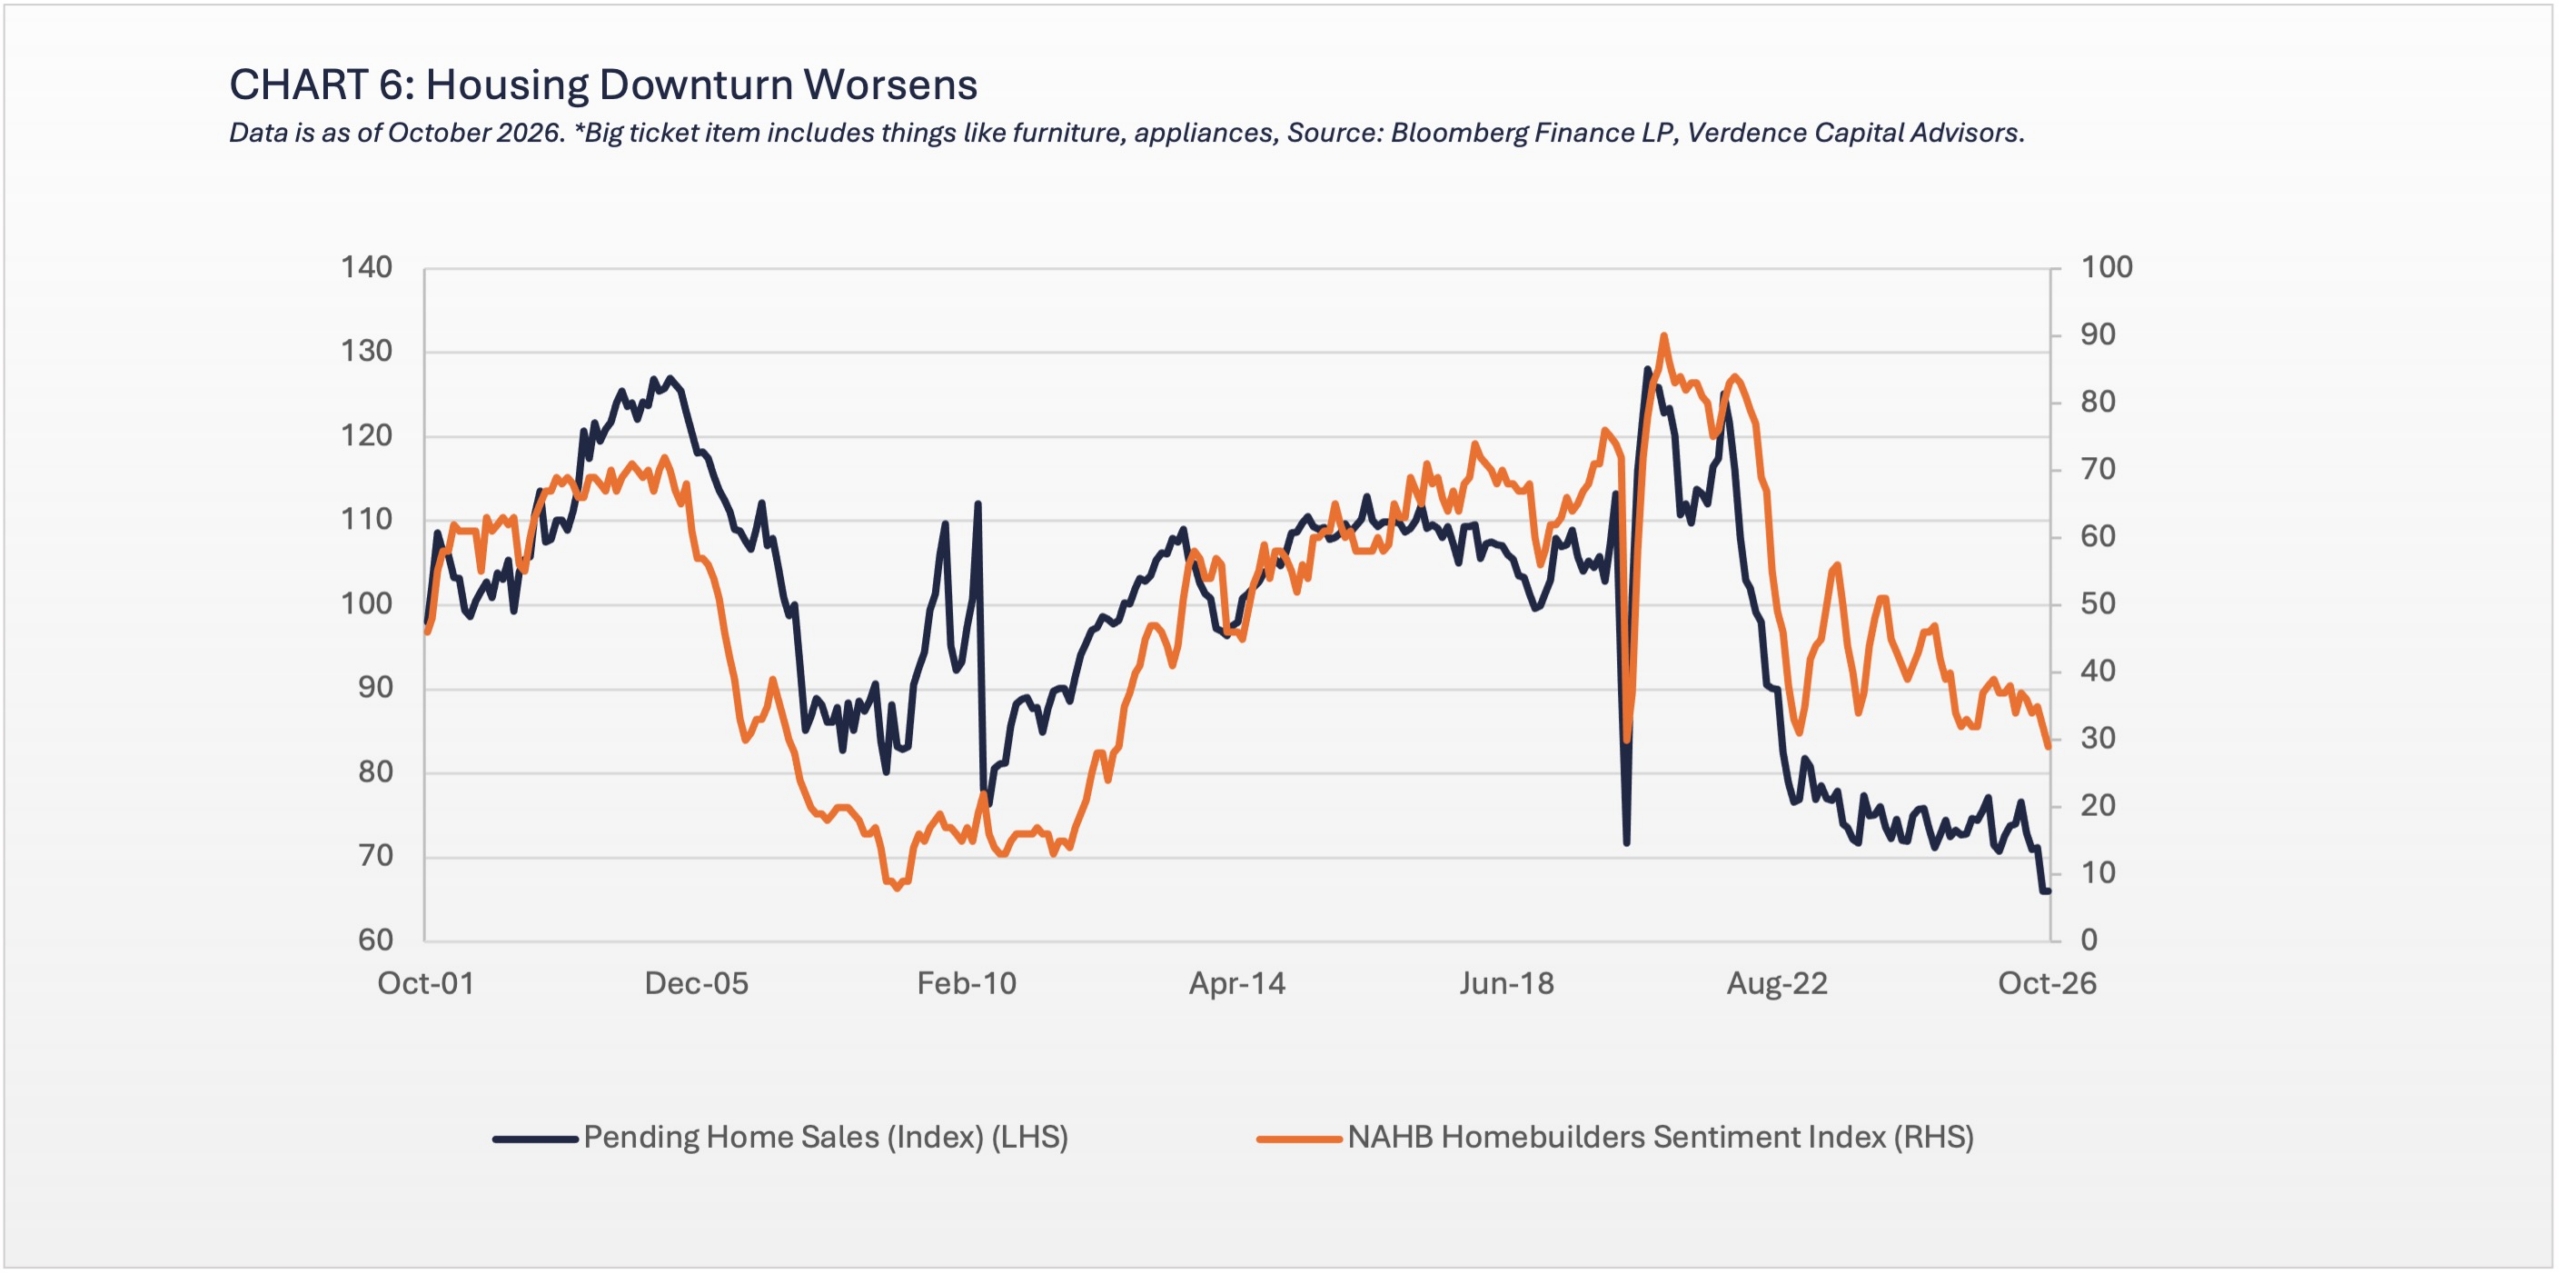
While the consumer and capex spending should continue to drive economic growth, housing is in a sharp downturn. Rising material costs and the highest mortgage rates since 2023 have pushed housing activity into a near standstill. In fact, the pending home sale index is at a record low while homebuilder sentiment and prospective buyers’ traffic have fallen to the lowest level since the housing crisis (2008-2009). (chart 6). While residential investment is a small share of GDP (less than 5%), fewer home sales also mean less spending on furniture, appliances and electronics which have an impact on the personal consumption portion of GDP.
Economy Bottom Line
We expect the expansion to continue, but growth in the coming quarters will be largely concentrated in capex spending. If capex spending slows, it could threaten the expansion. The headwinds facing consumers are likely to weigh on spending in the coming quarters, and housing remains in a downturn with little catalyst for a recovery. While we are optimistic about the expansion continuing, we are closely watching the risks of prolonged geopolitical tensions, supply chain disruptions, inflation and higher interest rates as they may challenge our view
Federal Reserve and Inflation: Fed is not Done Yet
The market has adjusted well to the complete shift in Federal Reserve sentiment with the new Fed Chairman Kevin Warsh. The prior Fed Chairman’s long-held belief that inflation would drift back to its 2% target on its own has given way to a more hawkish approach. This includes the first interest rate hike since 2023 in 3Q26.
The Fed funds futures market is currently predicting two to three more rate hikes over the next 12 months. While the Fed holds a dual mandate of price stability and maximum employment, they have made it clear that they are currently more concerned about inflation. Especially since the unemployment rate remains steady, jobless claims and continuing claims are low, and the labor force participation rate has improved. Therefore, they have flexibility to focus on finding the appropriate level of tightening to get inflation to their target after missing that target for the past 66 consecutive months.
AI and Wars Push Inflation Higher
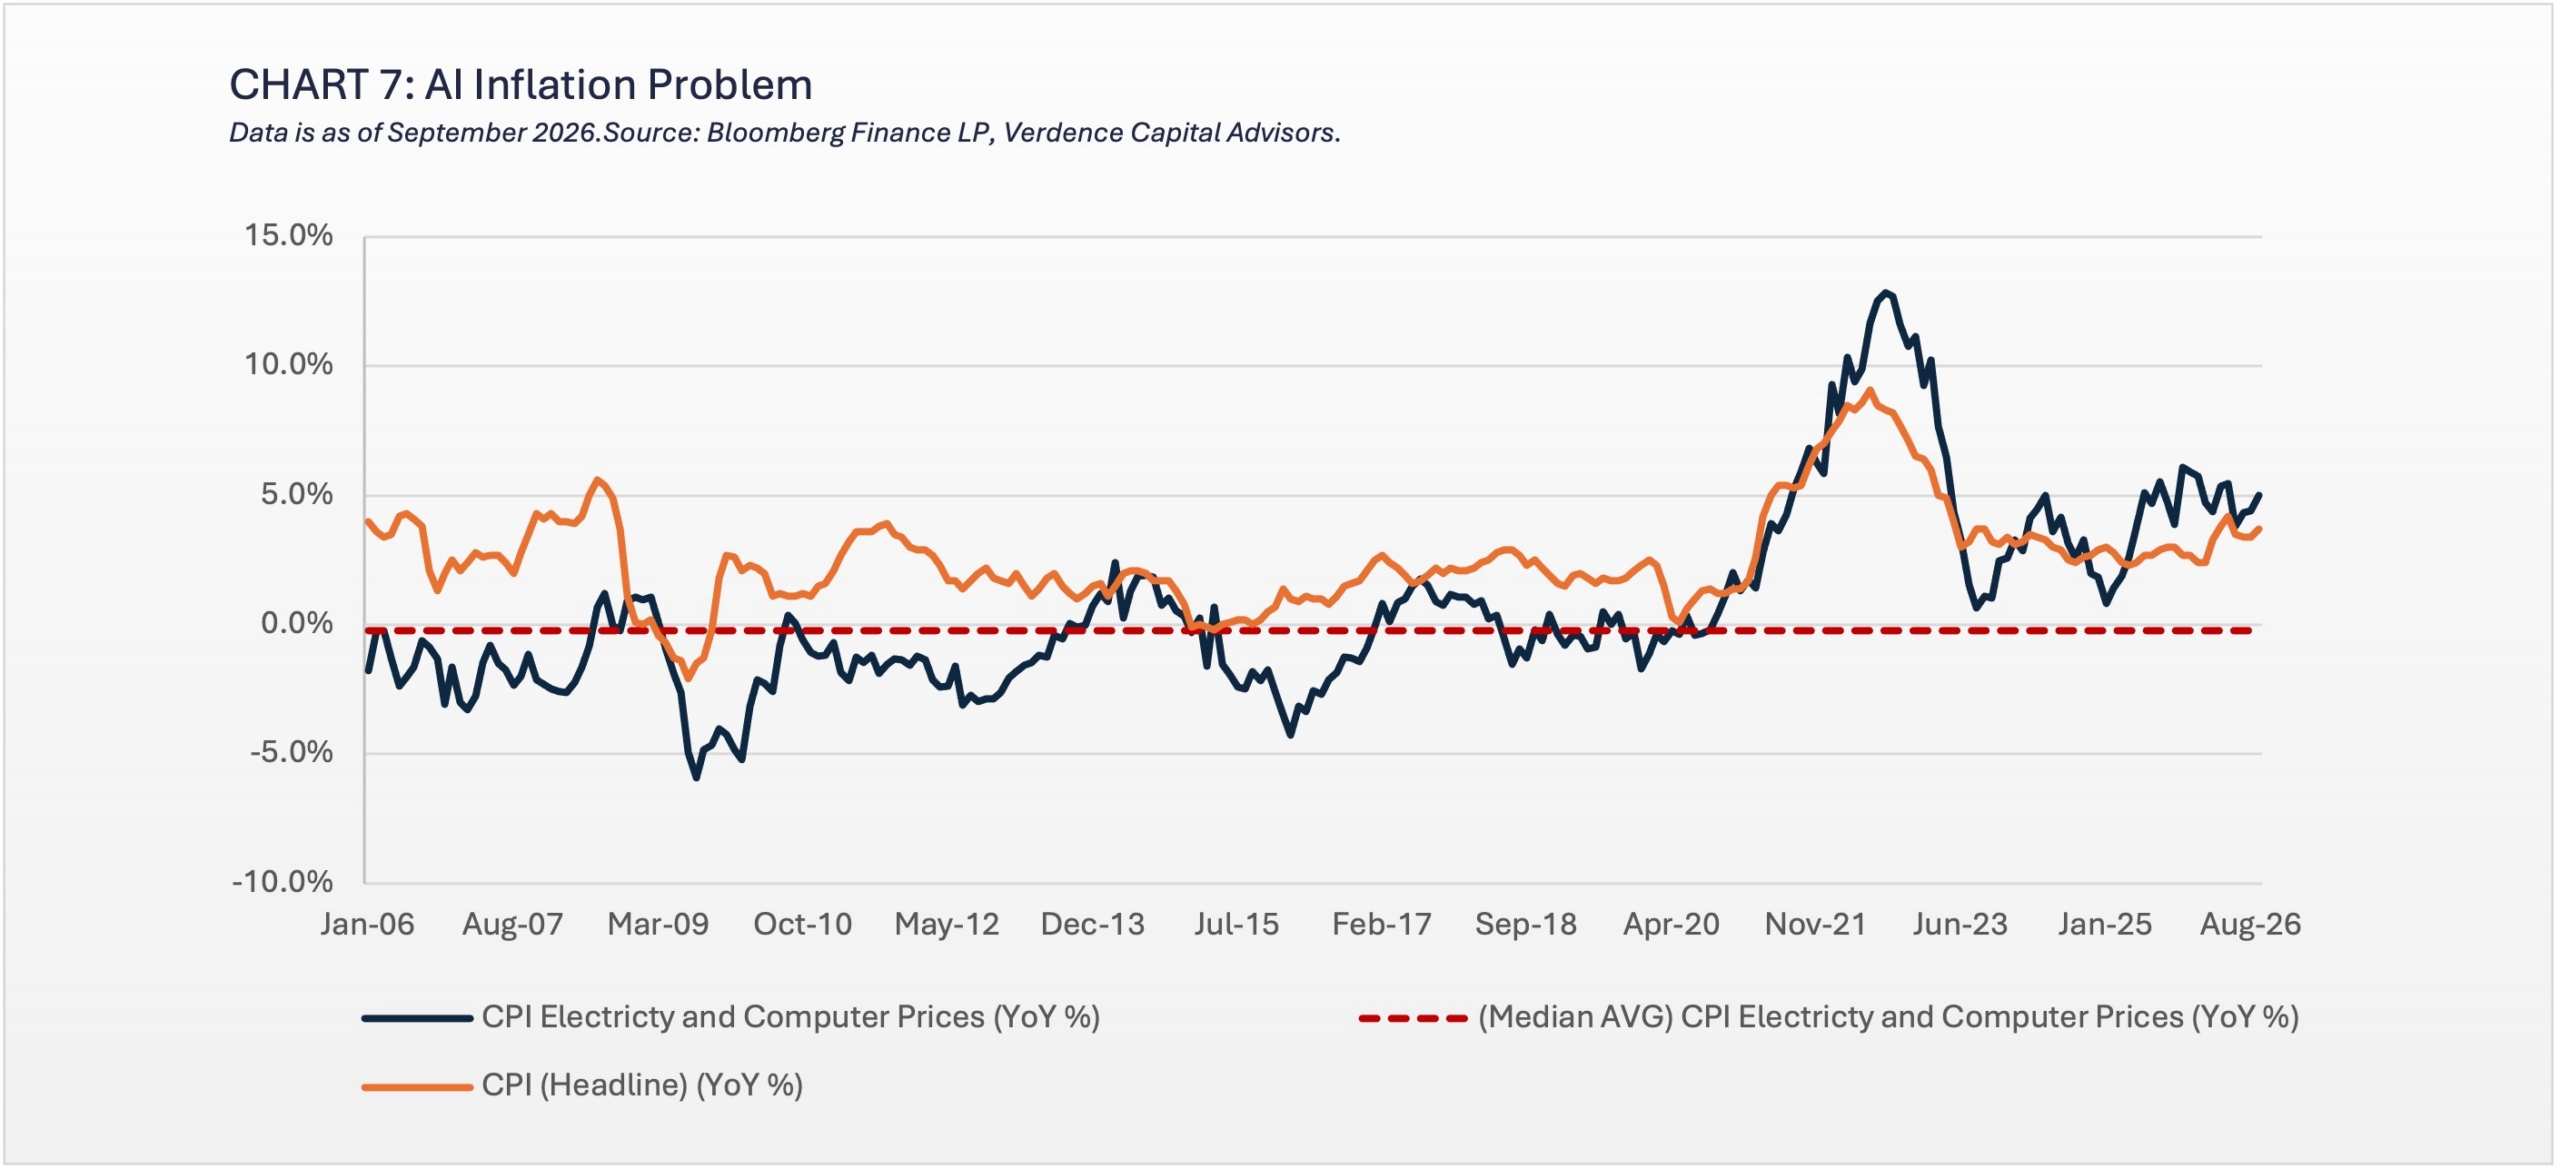
Unfortunately, the AI spending spree and prolonged wars are fueling inflation from two different directions and leaving the Fed with no choice but to continue tightening. The impact from AI spending has resulted in higher prices for many items but most notably electricity and consumer electronics. (chart 7). What is troubling is that some of these prices typically fall overtime (e.g. computers) or rise less than overall inflation (e.g., electricity), yet both are now climbing faster than the Consumer Price Index. A recent study by the Dallas Federal Reserve notes that national electricity prices could rise ~12% by 2028 due to the data center build out.1
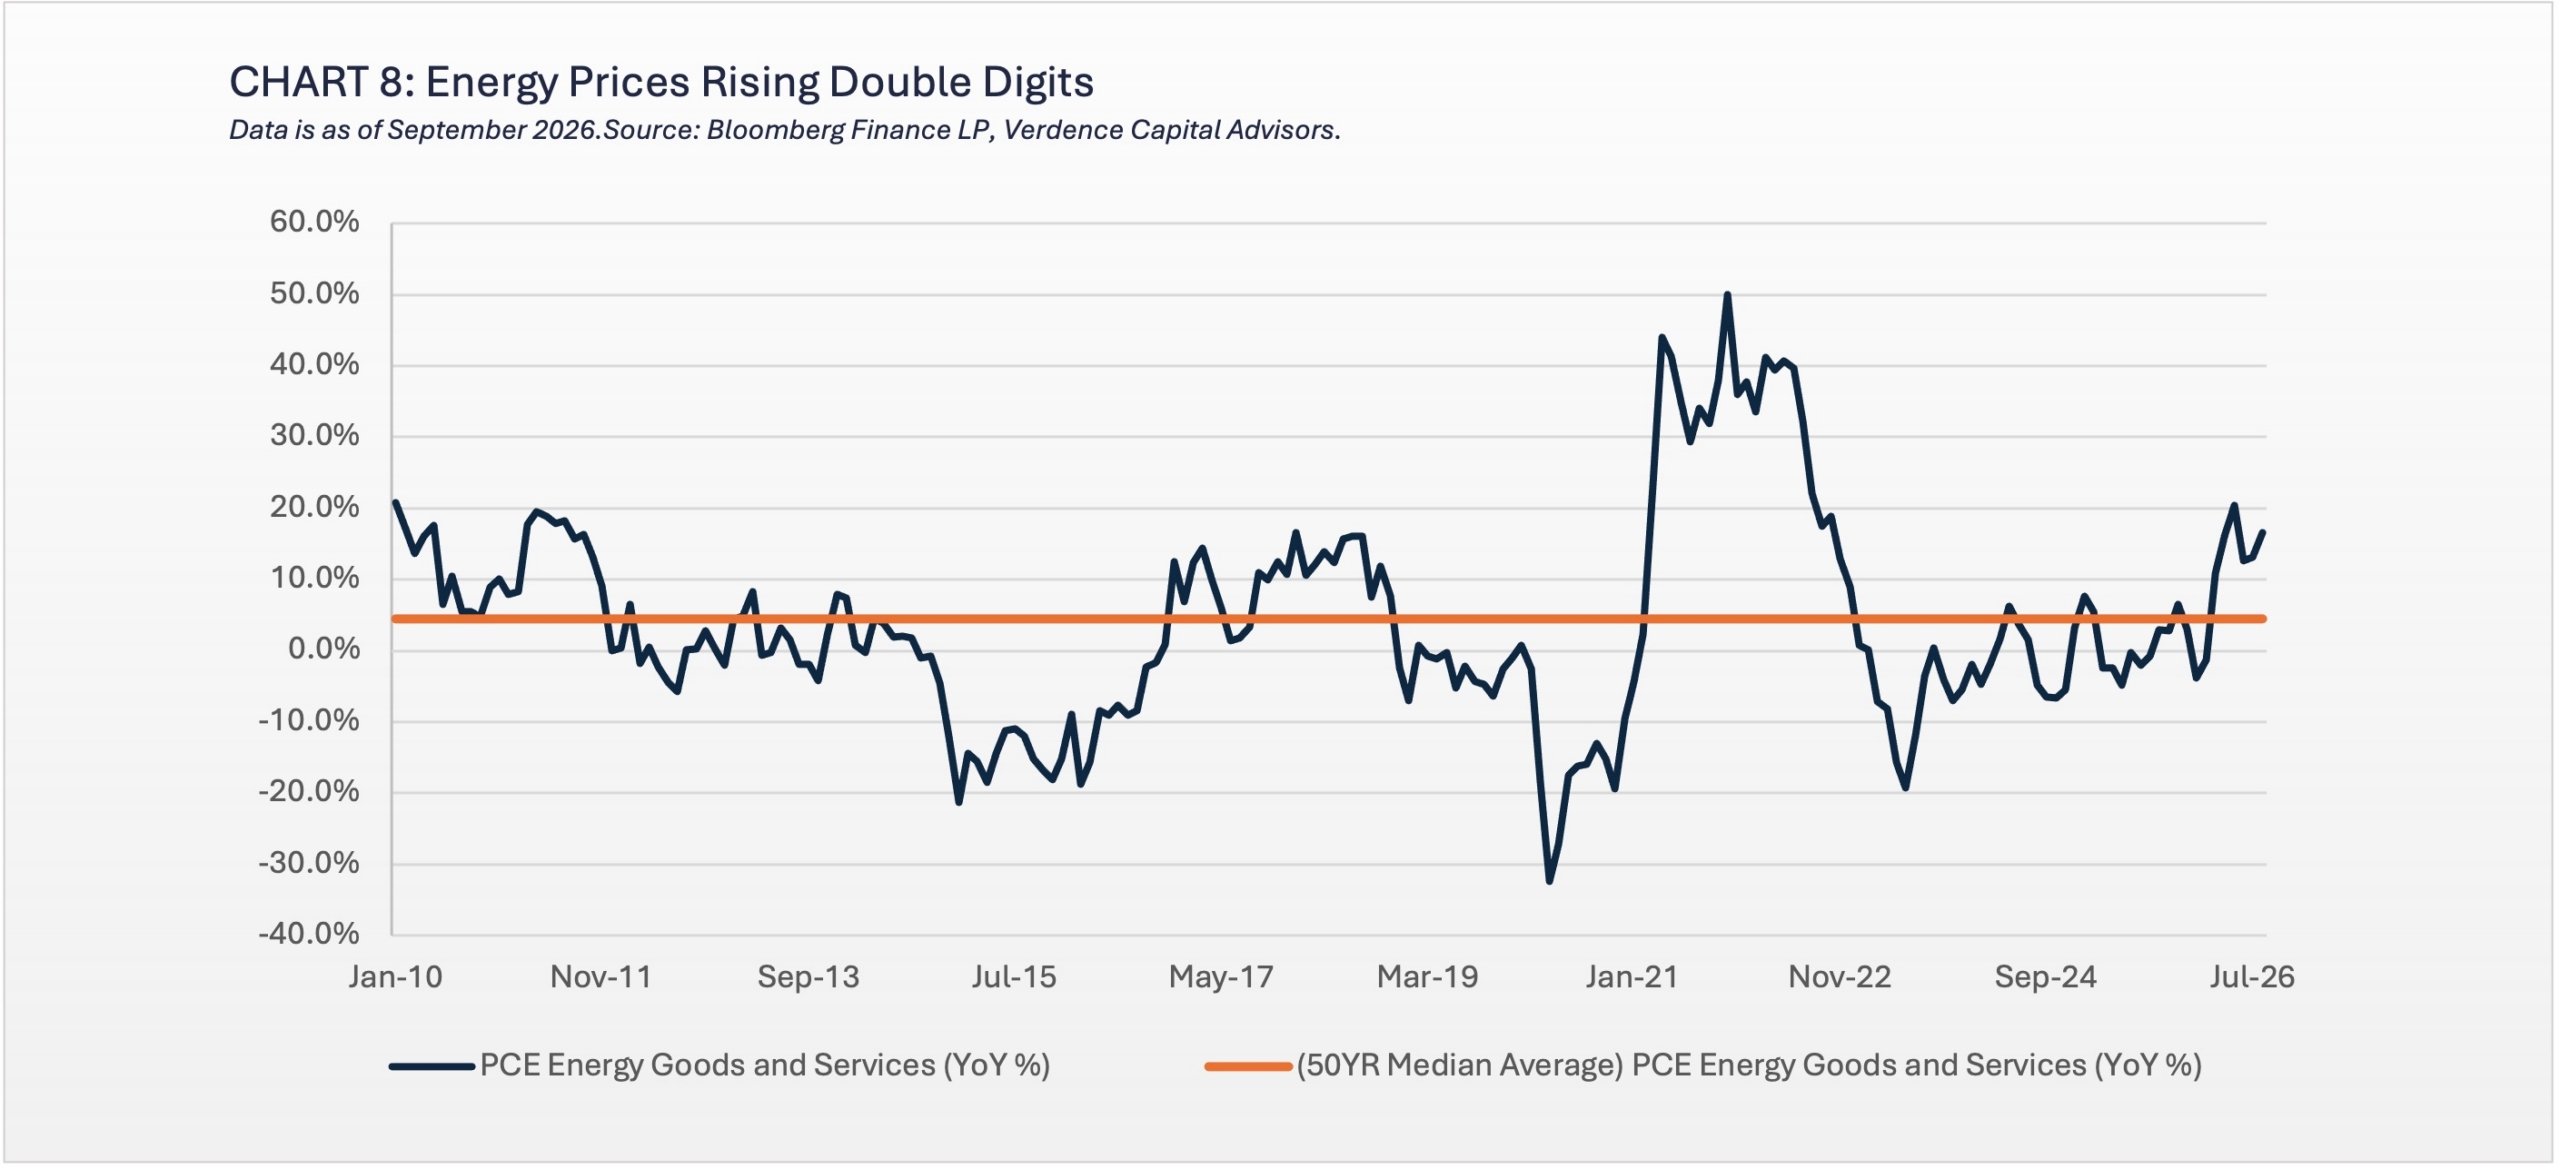
While AI spending is pushing prices from the demand side, the wars in Iran, Ukraine and Russia are driving prices higher on the supply side through higher energy costs and supply disruptions. (chart 8). Even if the wars were to end tomorrow and energy prices were to fall, inflation is proving stubborn beyond energy prices.
For example, the Atlanta Fed Core Sticky CPI Index is rising 3.4% on a three-month annualized basis, which is more than 1% above the 20-year average prior to COVID. Sticky inflation prices are those that change slowly (e.g., rent, insurance, medical care). Manufacturing and services prices paid as measured by the Institute of Supply Management are at the highest level seen in four years. In addition, the Federal Reserve’s recent Beige Book noted “price pressures broadening beyond energy, as fuel surcharges passed higher costs through supply chains.” In fact, in the Philadelphia district the indices for future prices paid and received recently rose to the highest over the past 35 years.
LISTEN NOW: Markets With Megan Podcast
Federal Reserve Bottom Line:
Currently, the Fed funds futures market expects one more rate increase in December and about half a percentage point of tightening over the next six to 12 months. However, monetary policy is far from restrictive. After adjusting for core inflation, the Fed funds rate remains low by historical standards, broad financial conditions remain loose, asset prices are near record highs, and the money supply is growing nearly 6% on a year over year basis. As a result, we believe the Fed will keep raising rates and may need to move more aggressively than markets expect to bring inflation back under control.
We do not believe yields, especially long-term yields, have peaked
Global Fixed Income – Bond Markets Matter
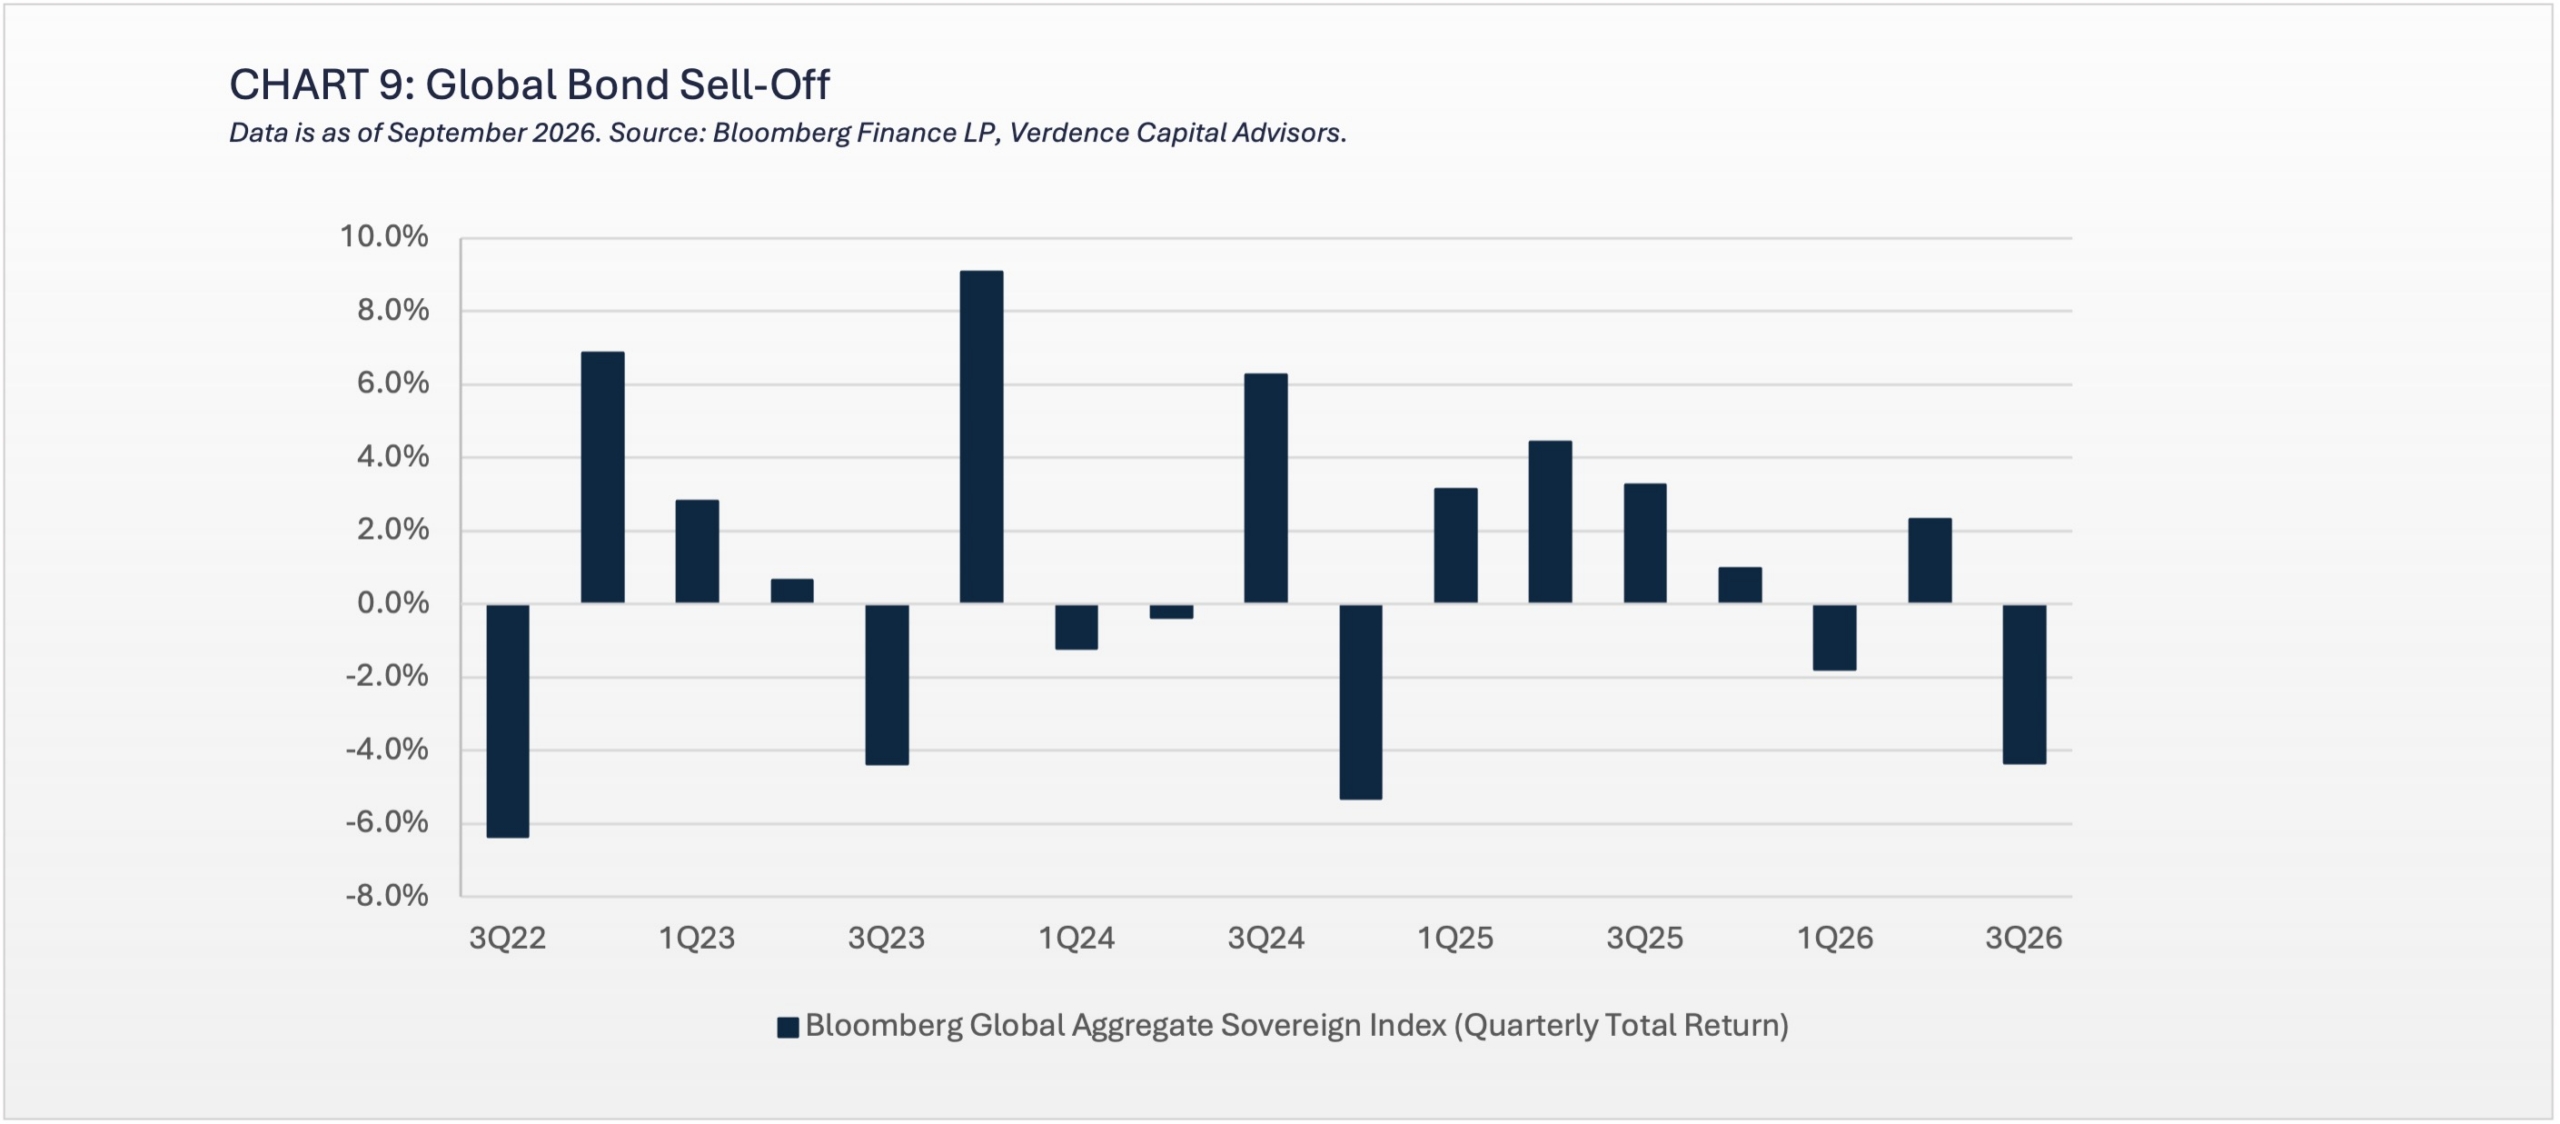
The global bond market experienced a harsh repricing of interest rate expectations in 3Q26. In fact, rising inflation, less demand for sovereign bonds and central bank rate hikes spurred a sharp quarterly decline in the Bloomberg Global Aggregate Sovereign Index. (chart 9). The sell-off was especially brutal in long-term interest rates. The 30YR Treasury yield rose ~70 bps, while the German Bund, UK Gilt and Canada’s 30YR yields all rose ~50 bps. Although yields have eased from their early October highs, global sovereign bonds are on pace to post their worst year since 2022 when the post-pandemic inflation surge drove yields higher. Many of the forces that pushed interest rates higher in 3Q26 remain in place and we do not believe yields, especially long-term yields, have peaked. We see five main headwinds for long-term bonds.
Deficits are only getting worse:
The federal deficit has reached $2.0 trillion, or 6.2% of GDP, a level typically seen only during recessions not during an expansion. Unfortunately, the CBO projects the annual deficit will grow to $3.1 trillion by 2036 (or 6.7% of GDP). After years of funding these deficits with little resistance, bond investors are now demanding higher yields to hold long-term debt from countries with weakening finances.
Bigger buyers stepping back:
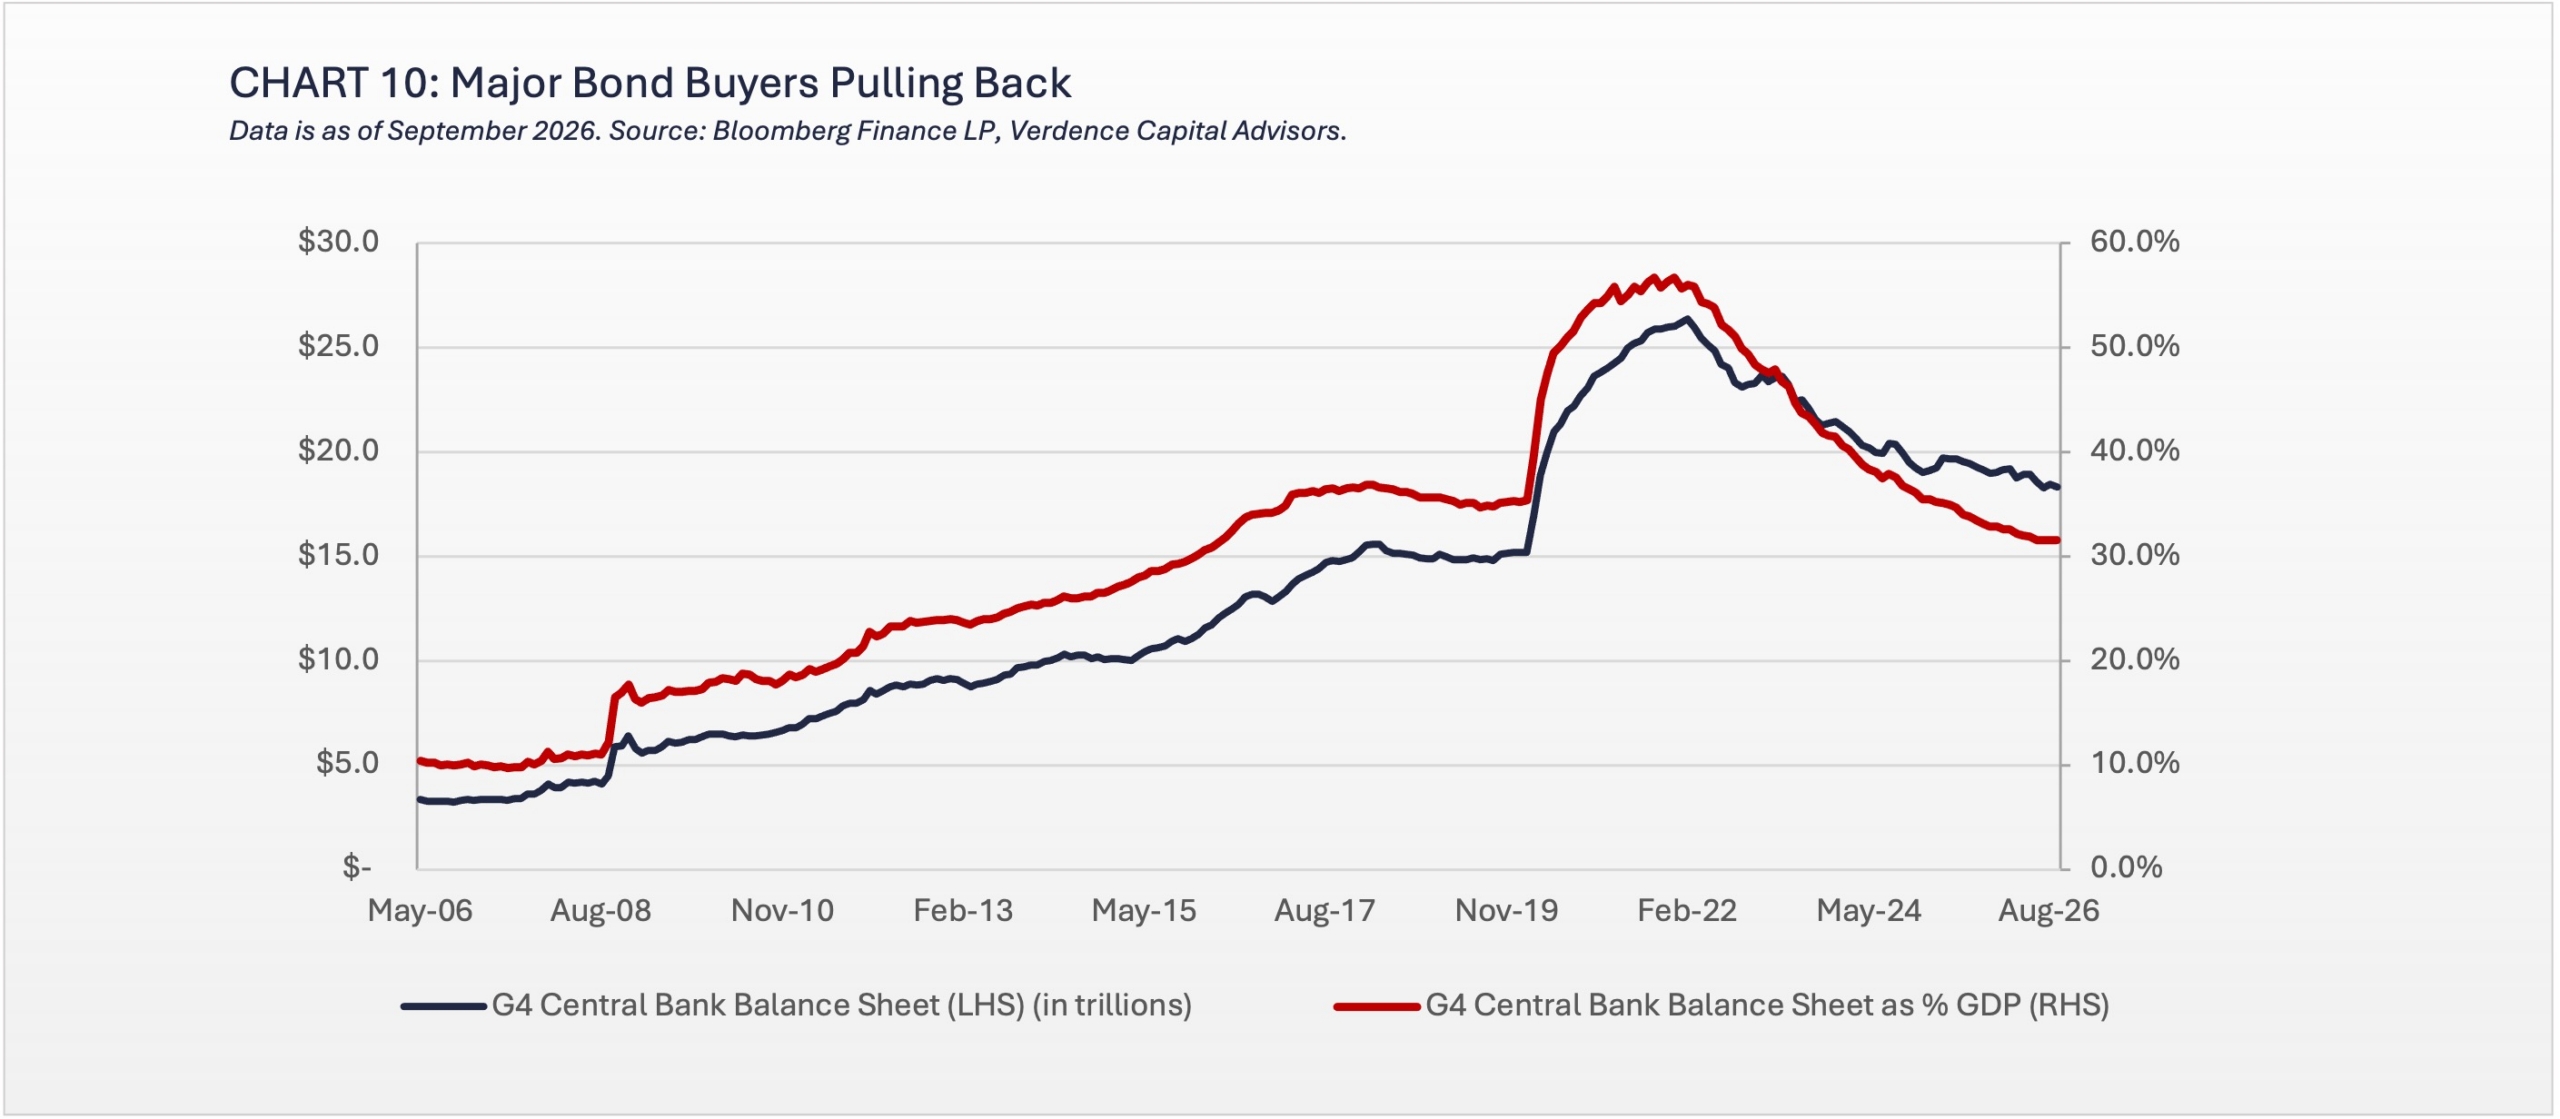
Since the Great Recession, central banks have been one of the largest buyers of government debt through quantitative easing. The combined balance sheets of the G4 central banks peaked at ~ $25 trillion, nearly 60% of their combined GDP, after the pandemic (chart 10). However, the Fed’s balance sheet has since fallen by more than $2 trillion from its 2022 peak, while U.S. federal debt has grown by roughly $10 trillion over the same period. This is a supply/demand imbalance that is unsustainable and can push yields higher.
Growing competition:
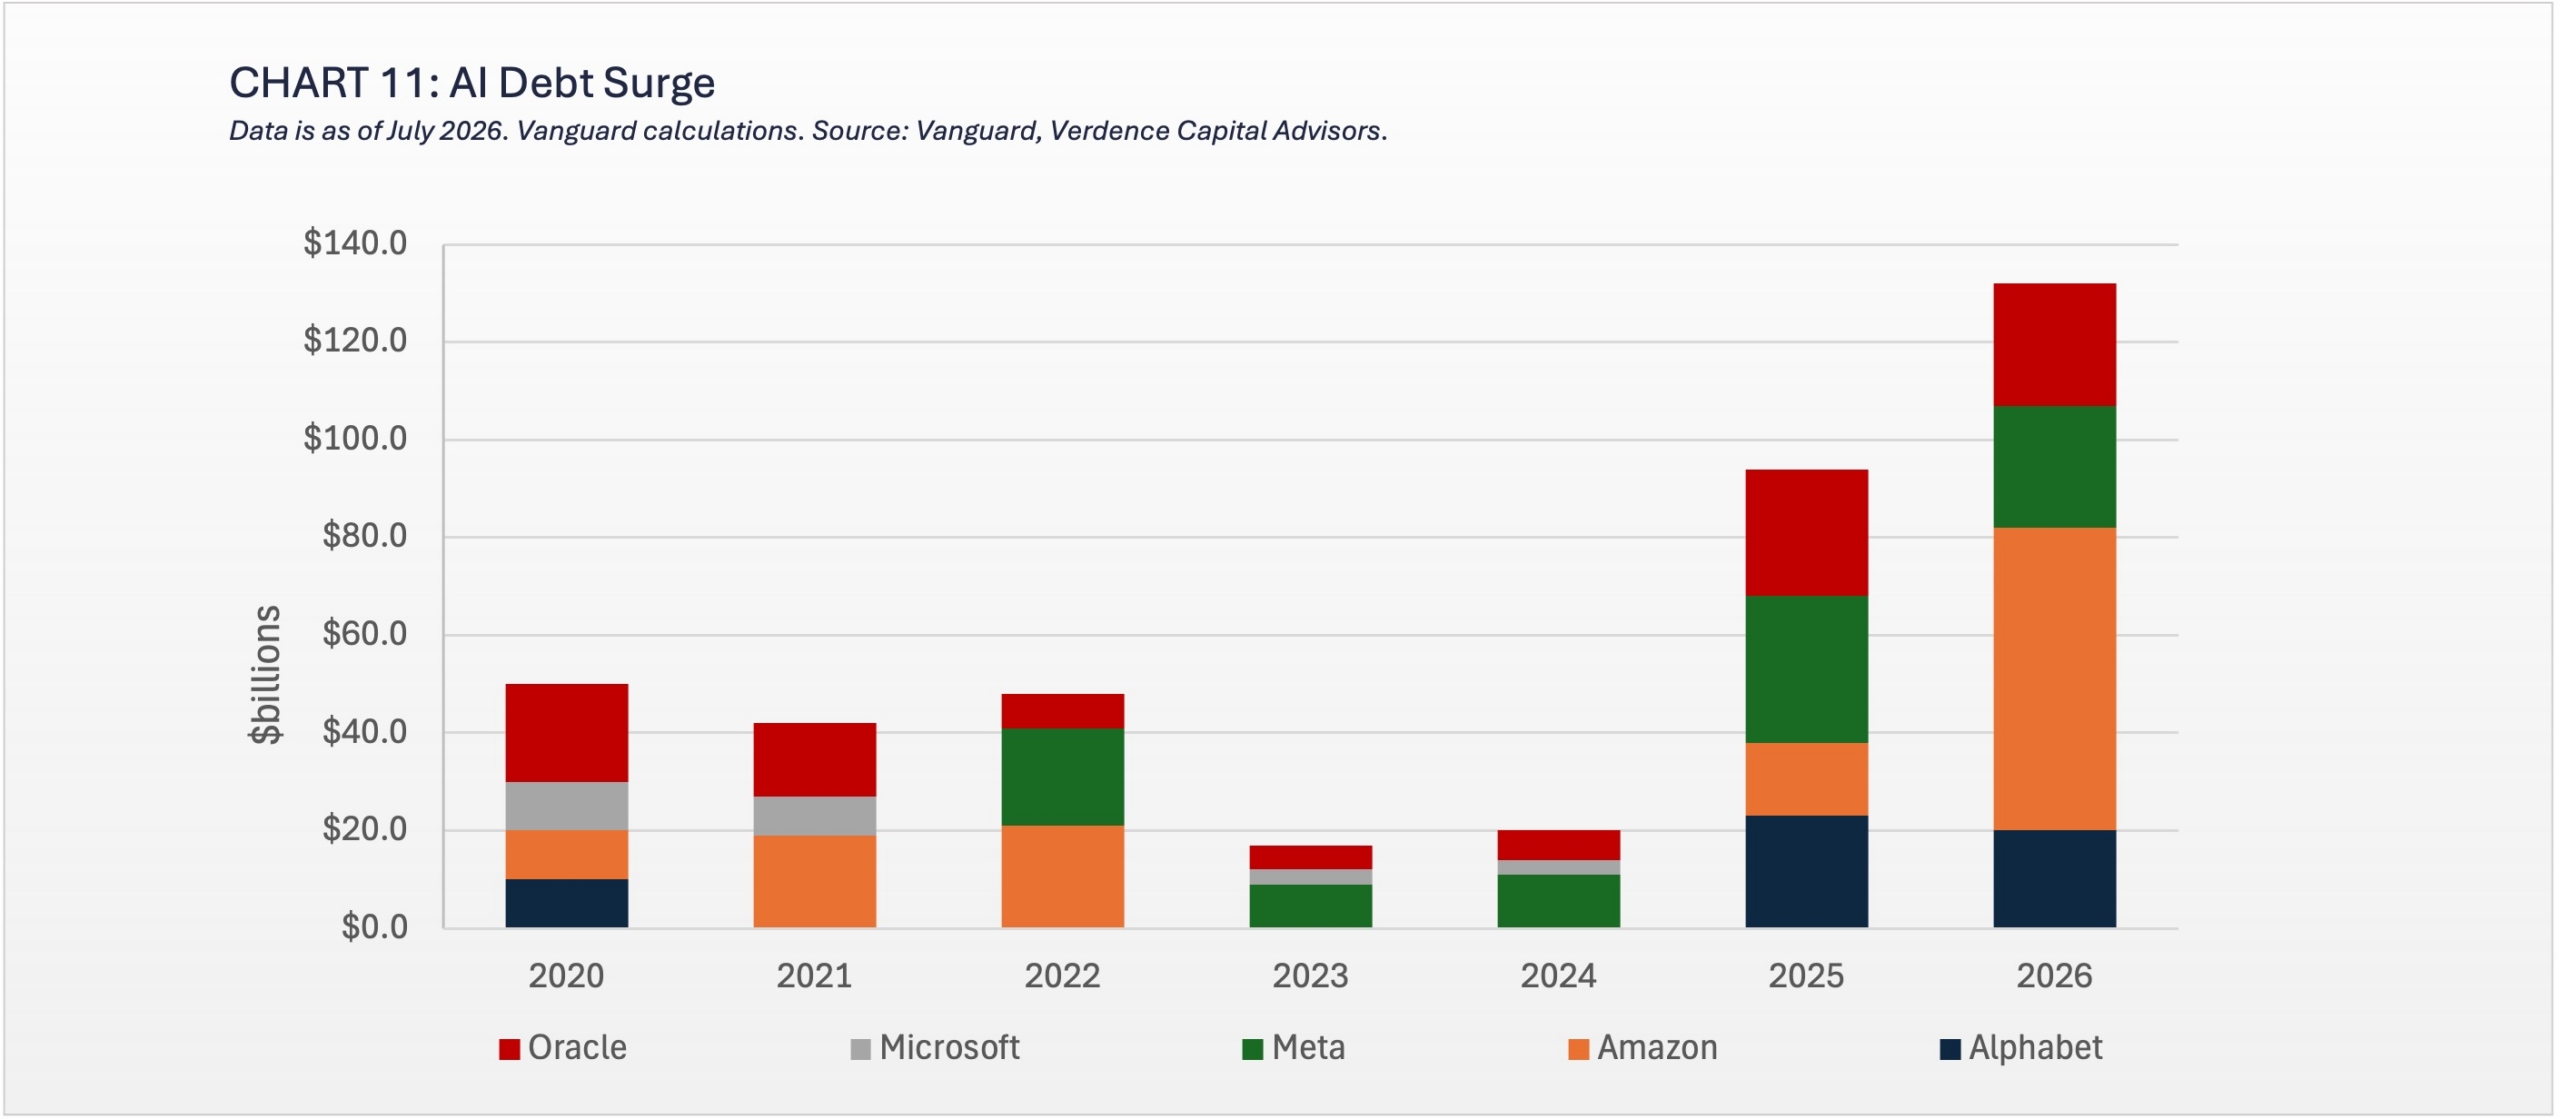
The largest technology companies have typically funded most of their investment from operating cash flow for the past decade. However, they are now turning to the bond market to pay for the data center buildout as their capital spending has outpaced cash flow. In fact, issuance from hyperscalers has grown from $17 billion in 2023 to over $120 billion in 2026 (chart 11).2 They have made up over 10% of the investment-grade issuance this year, up from ~2% in 2024.2 Since these hyperscalers are typically rated investment grade, investors are seeing this as another way to invest in AI aside from investing in equity, and money is shifting away from sovereign debt.
Inflation is causing investors to ask for more:
We see few catalysts to bring inflation down meaningfully in the near term. The Fed projects core PCE inflation of 3.4% in 2026, with a return to its 2% target only by 2029. That keeps upward pressure on yields for the next few years as the Fed has little to no ability to cut rates.
Nominal growth and the correlation to long-term yields:
Historically, the 10YR Treasury yield and year-over-year change in nominal GDP follow closely together. Given the most recent consensus (through Bloomberg) and Federal Reserve estimates, nominal GDP is likely to grow 5.00-5.50% in the coming quarters, which would suggest the 10YR Treasury yield offers little value at current levels. Therefore, we see little need to extend duration at this point but do not rule out adding some duration if 10YR yields move closer to 5.50%. The only area that we would consider adding duration would be in the Municipal bond market. Yields have increased sharply this year, credit risk remains muted, and most municipal bond buyers are buy-and-hold investors.
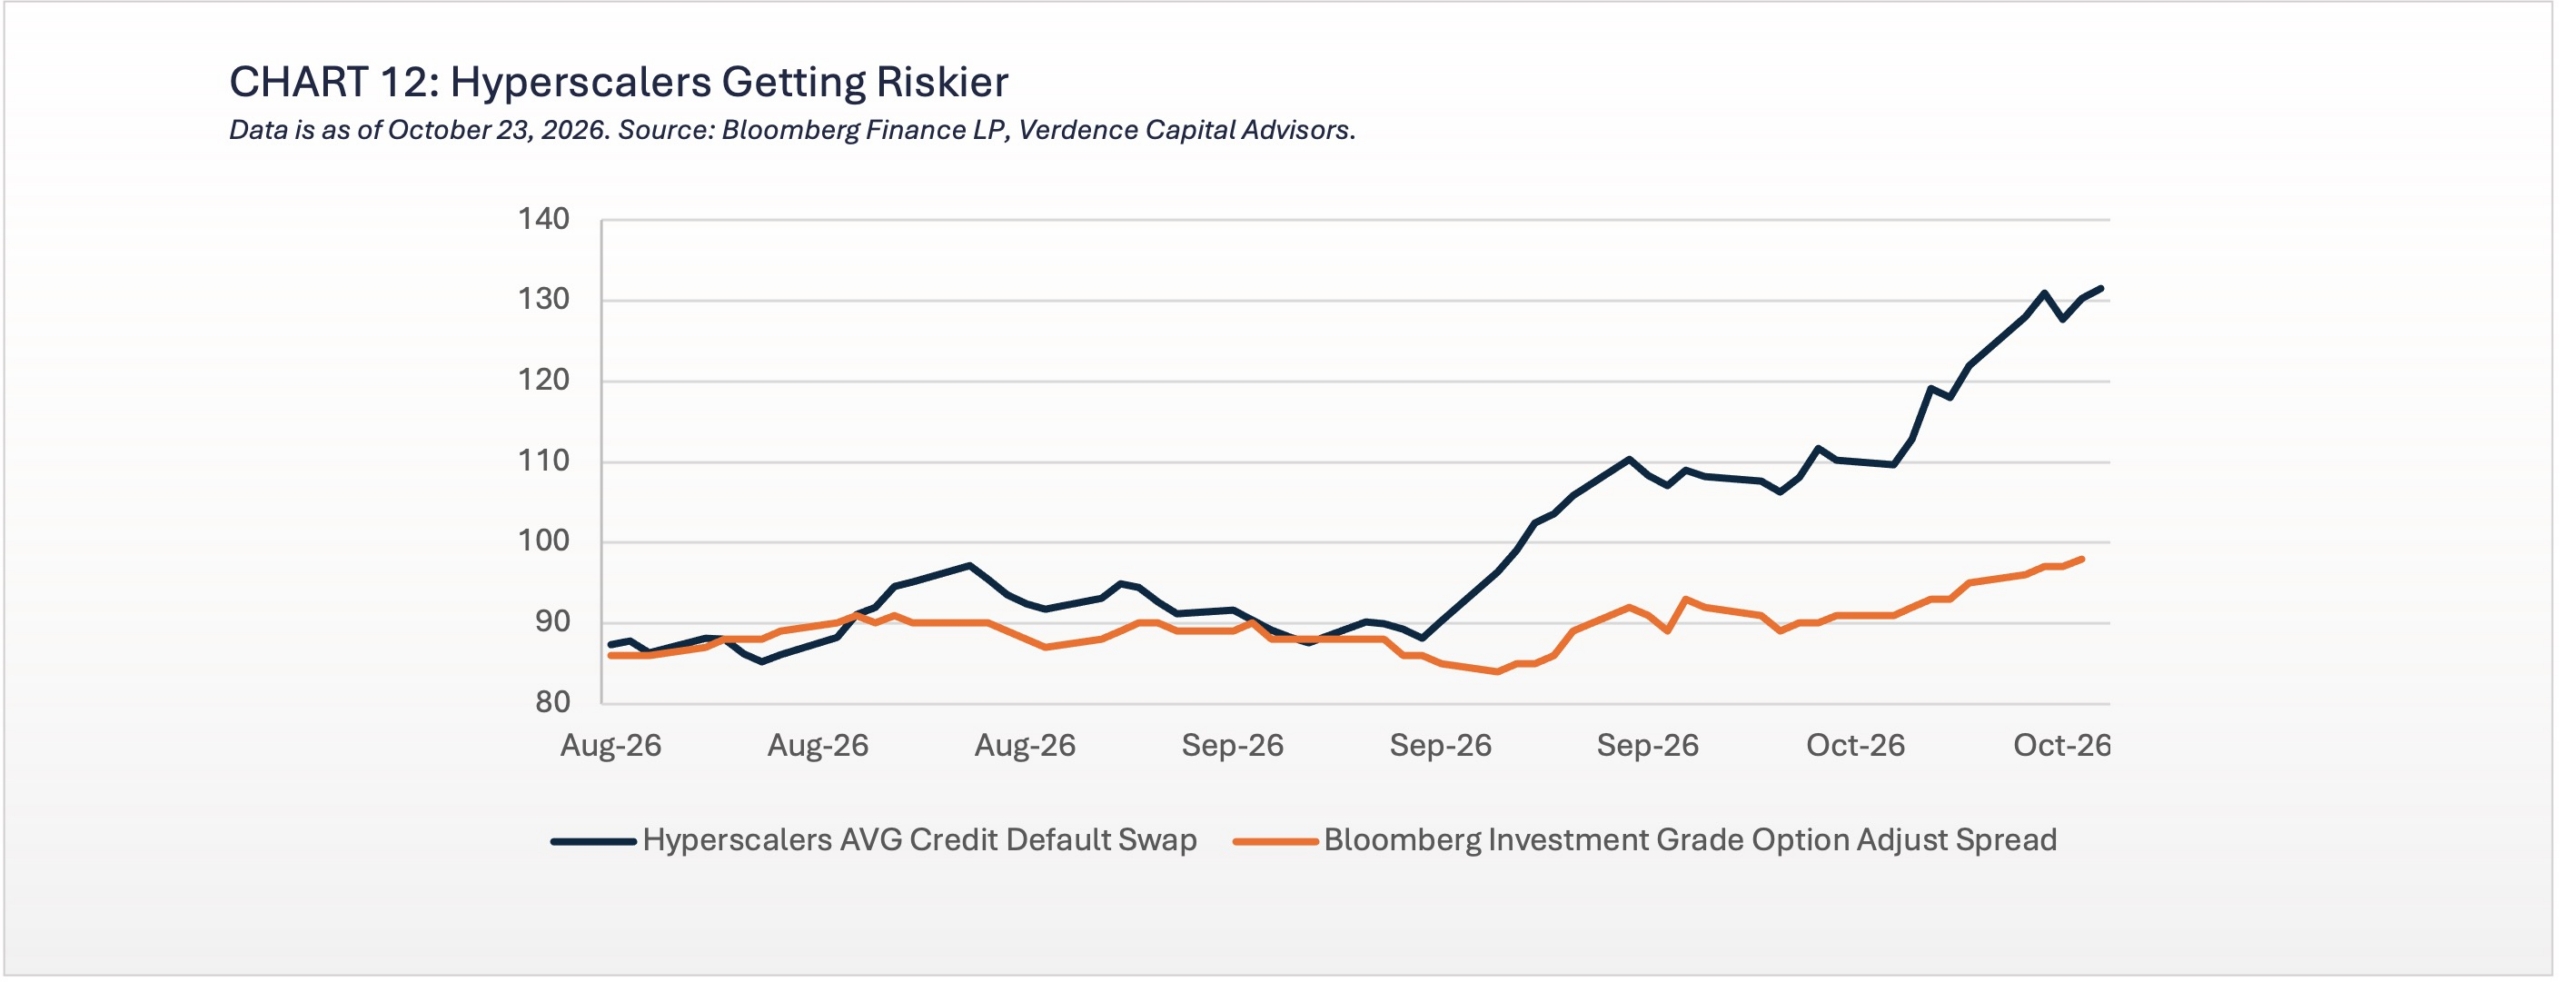
From a credit perspective, we still believe spreads do not justify the risk of investing in corporate bonds. We are beginning to see cracks emerge, especially around spreads of bonds related to the investment in AI. (chart 12). However, overall corporate spreads are still historically low. We would prefer another 50 to 100 bps of spread widening in investment grade and high yield, respectively before investing.
Fixed Income Bottom Line
With deficits growing, major bond buyers stepping back, and inflation well above target, we believe the pressures triggering this year’s rise in yields remain in place. Higher yields may provide better income than seen in prior years, but we see little need to extend duration or take unnecessary credit risk at current levels. We will look to add duration selectively if long-term yields move higher and/or our outlook on economic growth weakens.
Global Equities – Diversifying Beyond the AI Trade
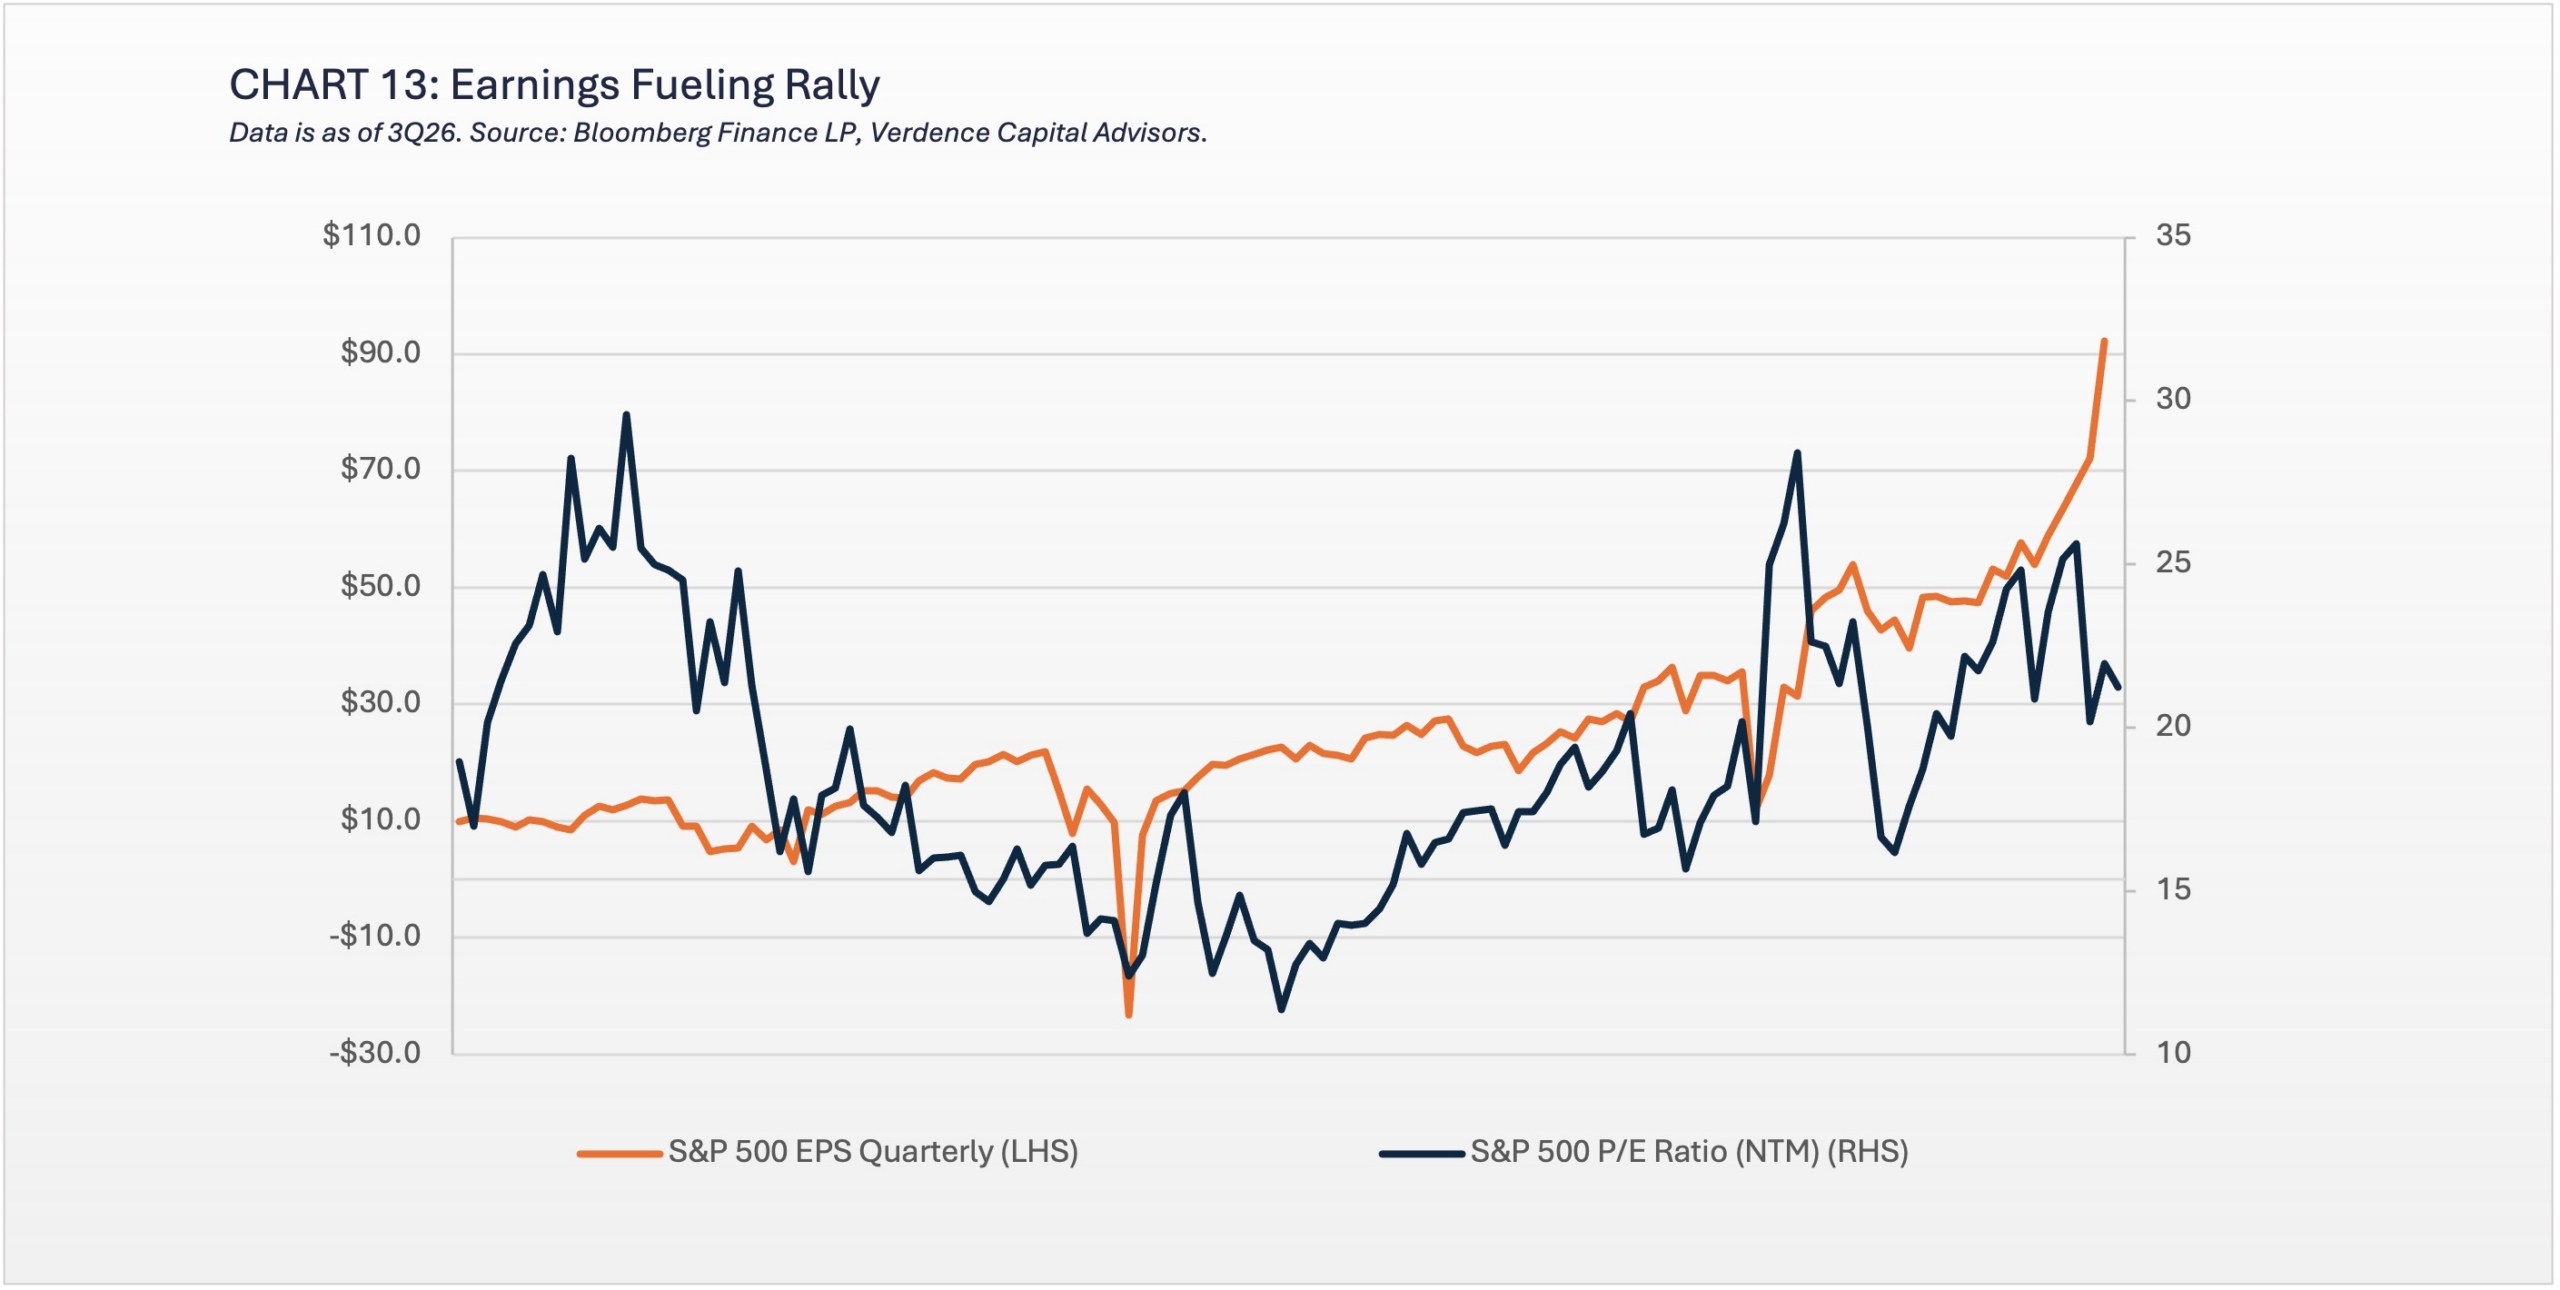
Global equities have shrugged off multiple wars, higher rates and rising inflation this year and at this point are posting their fourth consecutive year of double-digit gains (as of October 22). If this holds, this would be the first time since the aftermath of the Great Recession that the MSCI AC World Index was able to post four consecutive years of double-digit gains. What has differed this year is that the rally has not been driven by price to earnings multiple expansion as seen in prior years. Instead, strong economic growth, record corporate profits and enthusiasm around artificial intelligence have driven equity returns (chart 13).
While we remain optimistic that AI can boost economic growth, support corporate profit margins and enhance productivity across a variety of industries, the cost of building it is rising faster than the corresponding revenue. In addition, many companies are using the bond market to fund future investment but with higher interest rates the rising cost of capital is a concern. In 1H26 we trimmed our global equity exposure, primarily in the U.S. large cap space. We do not think we are in the later stage of the AI buildout, but we do think the euphoria around AI names is fading and investors are demanding more evidence that the excessive spending will pay off in the future. We remain constructive on equities over the long term and will consider periods of weakness as potential buying opportunities but believe caution is warranted in the near term for several reasons:
Earnings expectations leave little room for error.
According to FactSet, analysts are projecting earnings growth of 33% for 2026 and 16% for 2027. In addition, estimates have climbed steadily all year, with consensus 2026 EPS rising 16% between the end of February and early October.3 The earnings we have seen are also highly concentrated in the tech space. In fact, in 3Q26 alone, if you exclude NVIDIA and Meta from the Magnificent 7 earnings, the earnings growth would be 8% (YoY) compared to the 33% estimated for all the Mag 7 companies.
Cost of capital rising:
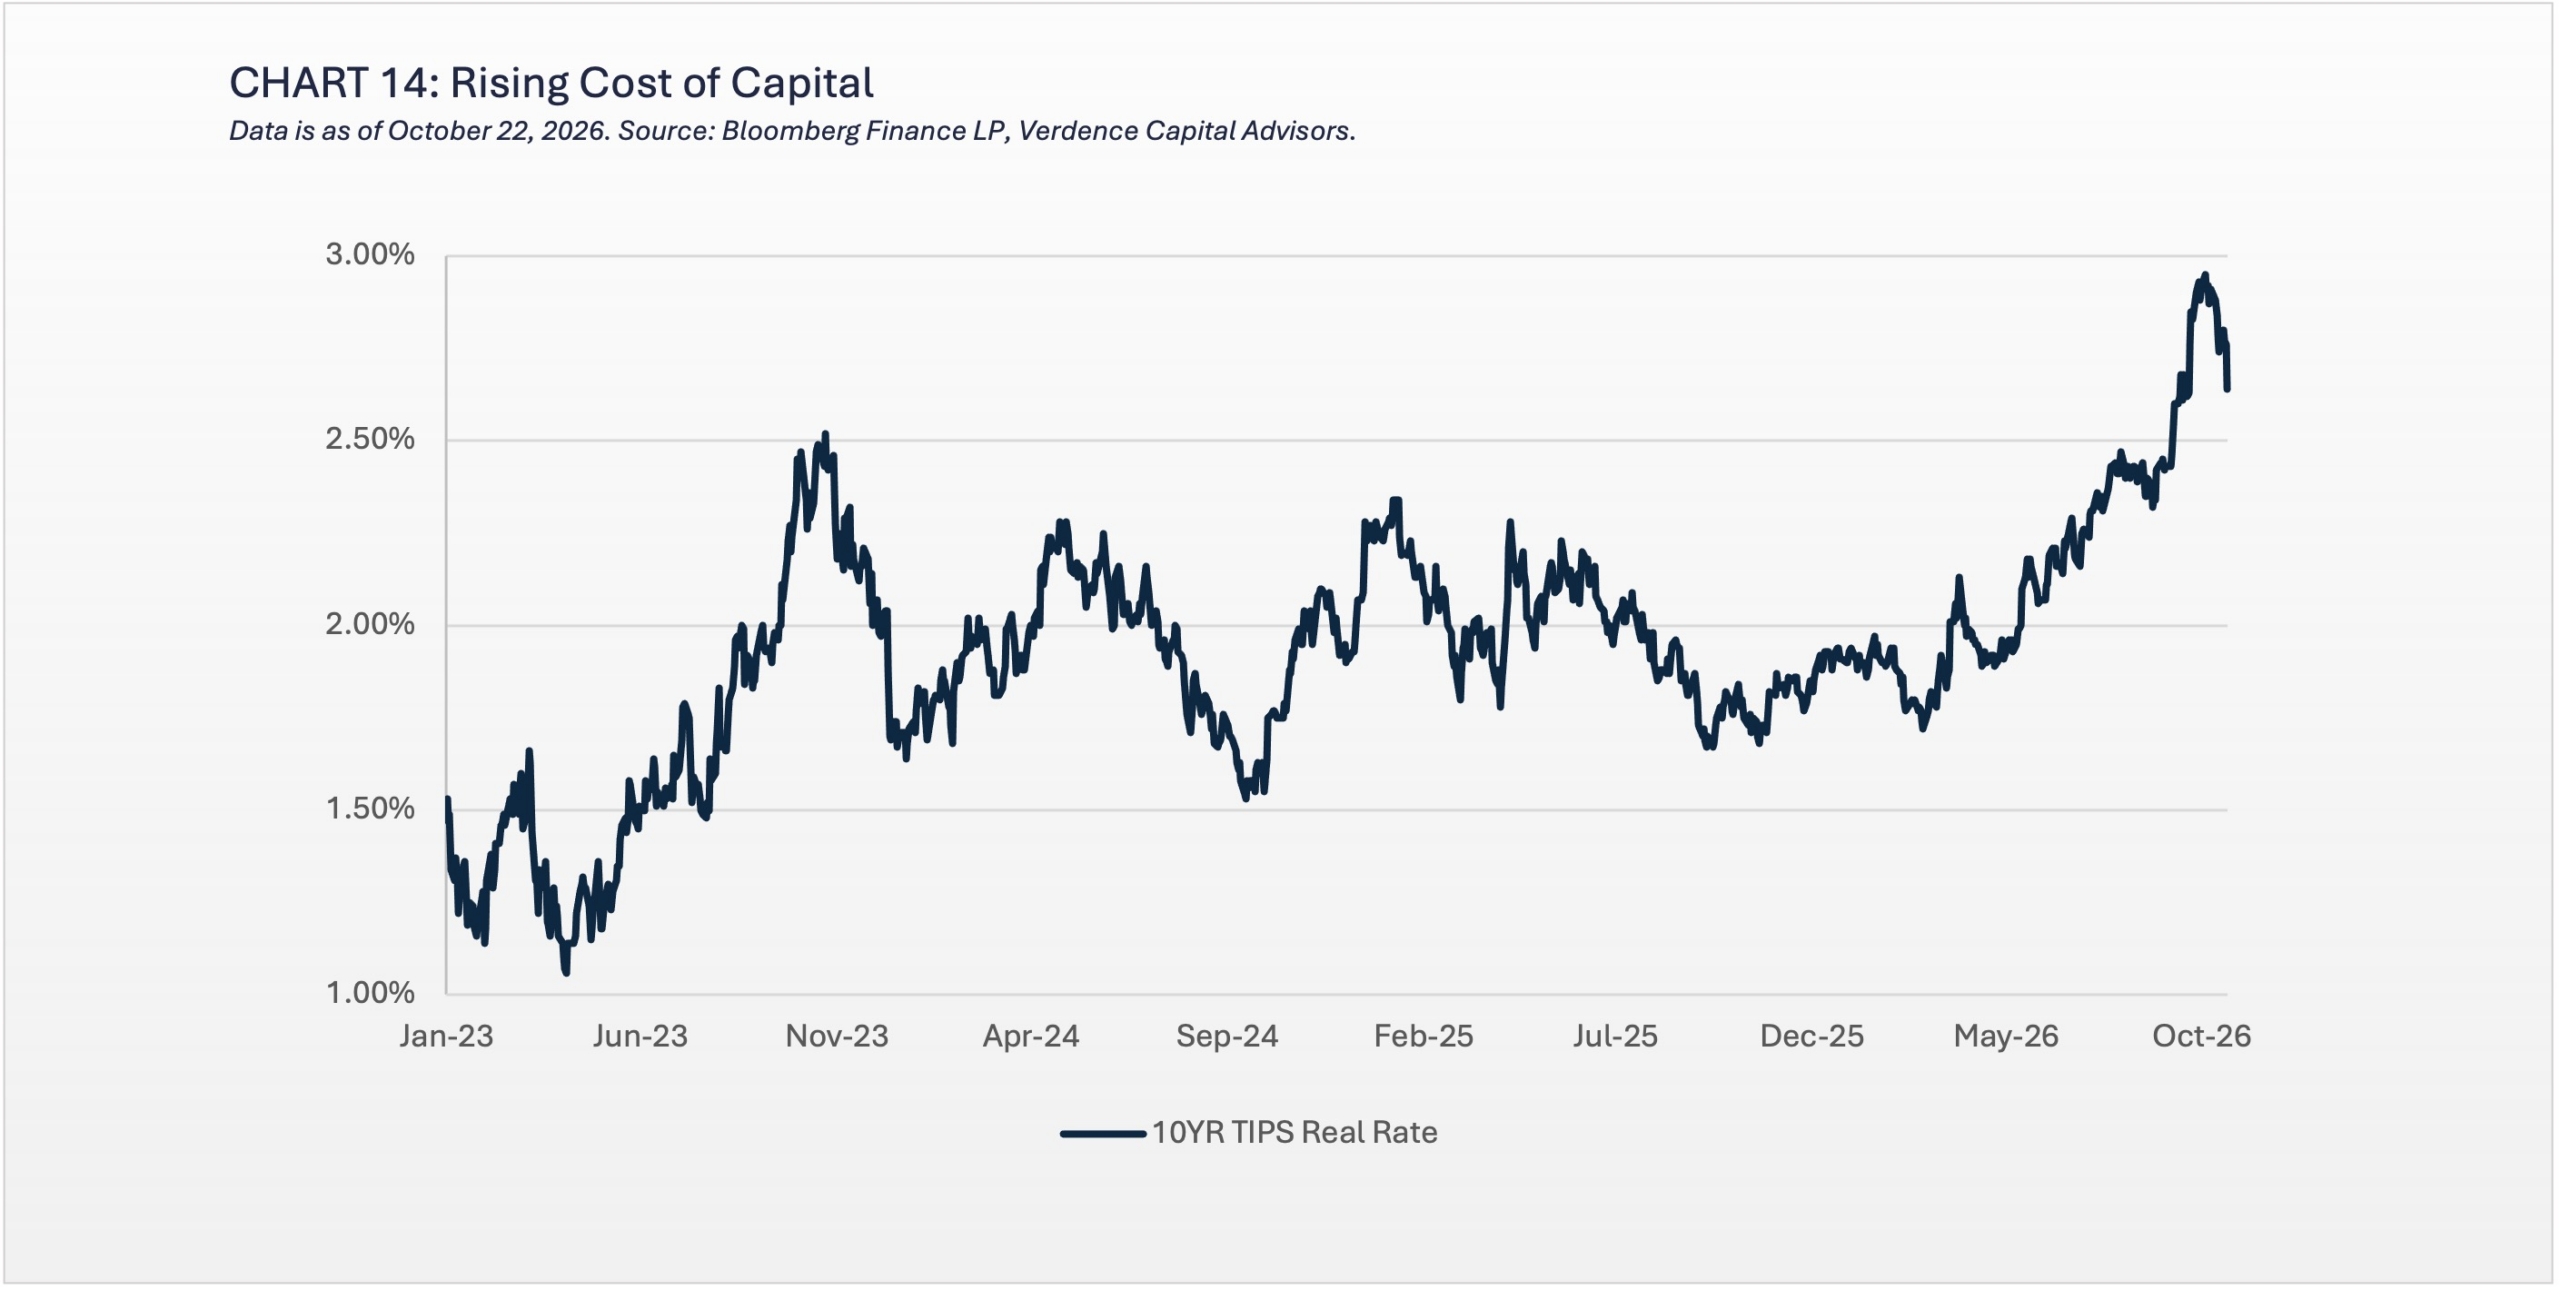
The rising cost of capital is a growing concern for equities as interest rates have increased. Real interest rates, as measured by the real yield on the 10YR Inflation Protected Security, have increased nearly 100 bps this year and it is likely we have not seen a peak in yields. (chart 14). This puts equities at risk as future earnings are worth less today when interest rates rise.
Bonds now offer real competition.
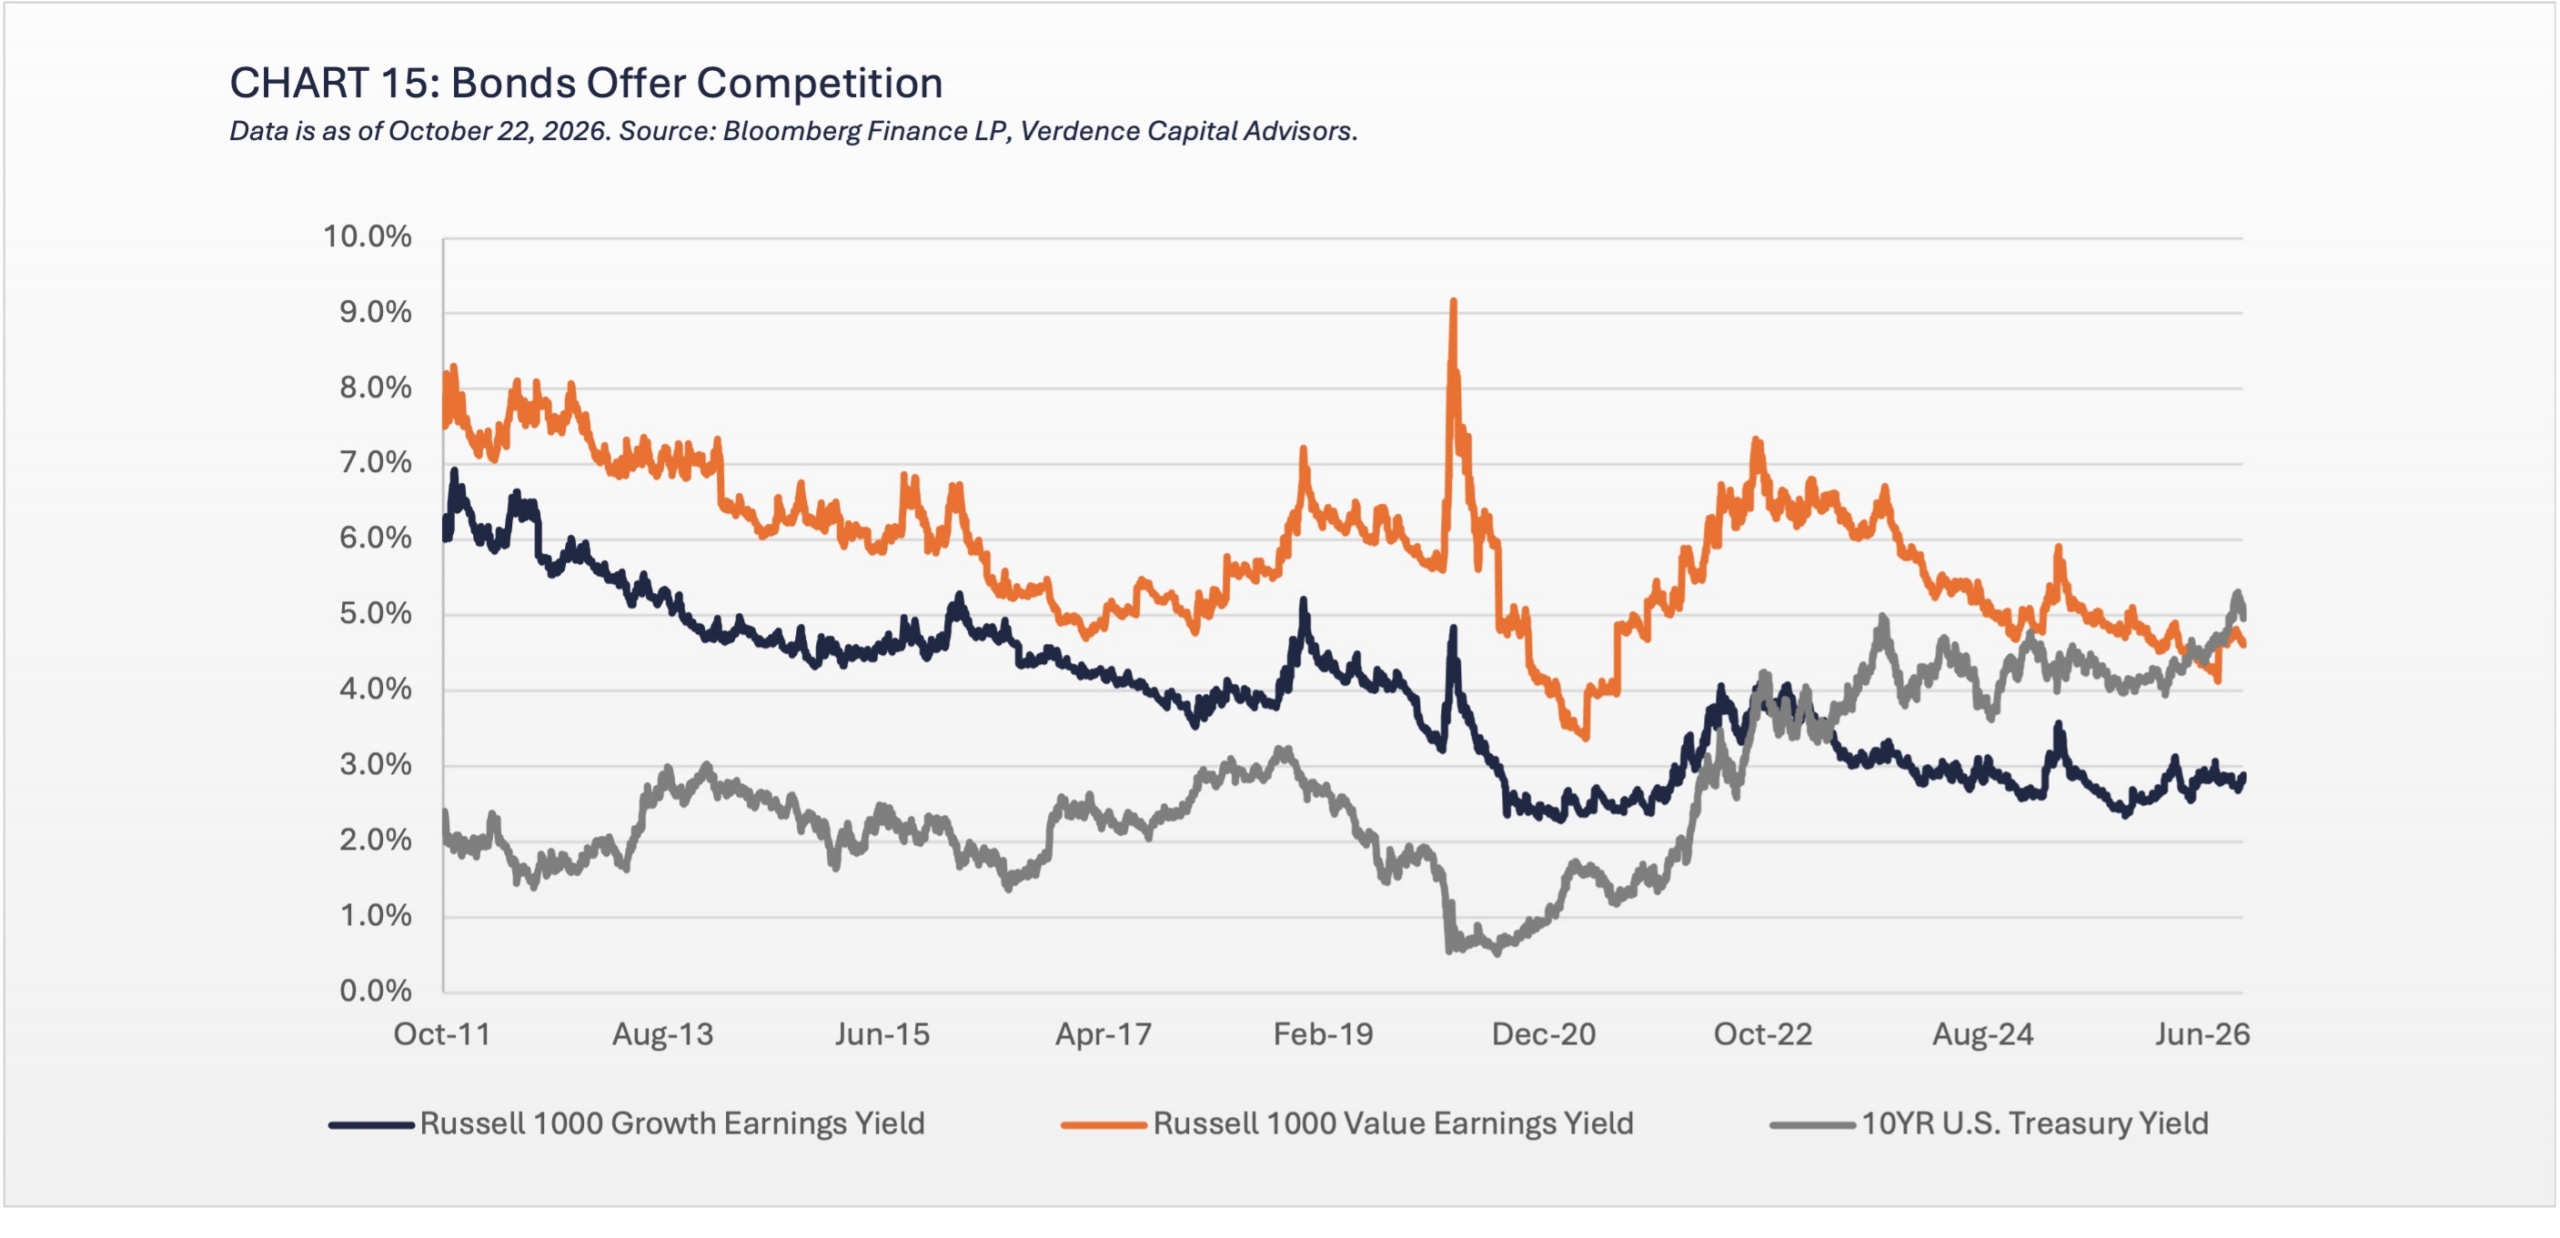
With the 10-year Treasury yielding over 5.0% investors can earn a yield over 100 bps above the S&P 500’s earnings yield (3.8% as of October 22, 2026) without taking the extra equity risk. In addition, the 10YR Treasury yield is now higher than the earnings yield of both the Russell 1000 Growth and Russell 1000 Value Index. This leaves little room for earnings error for large cap equities. (chart 15).
AI spending is eroding cash flow.
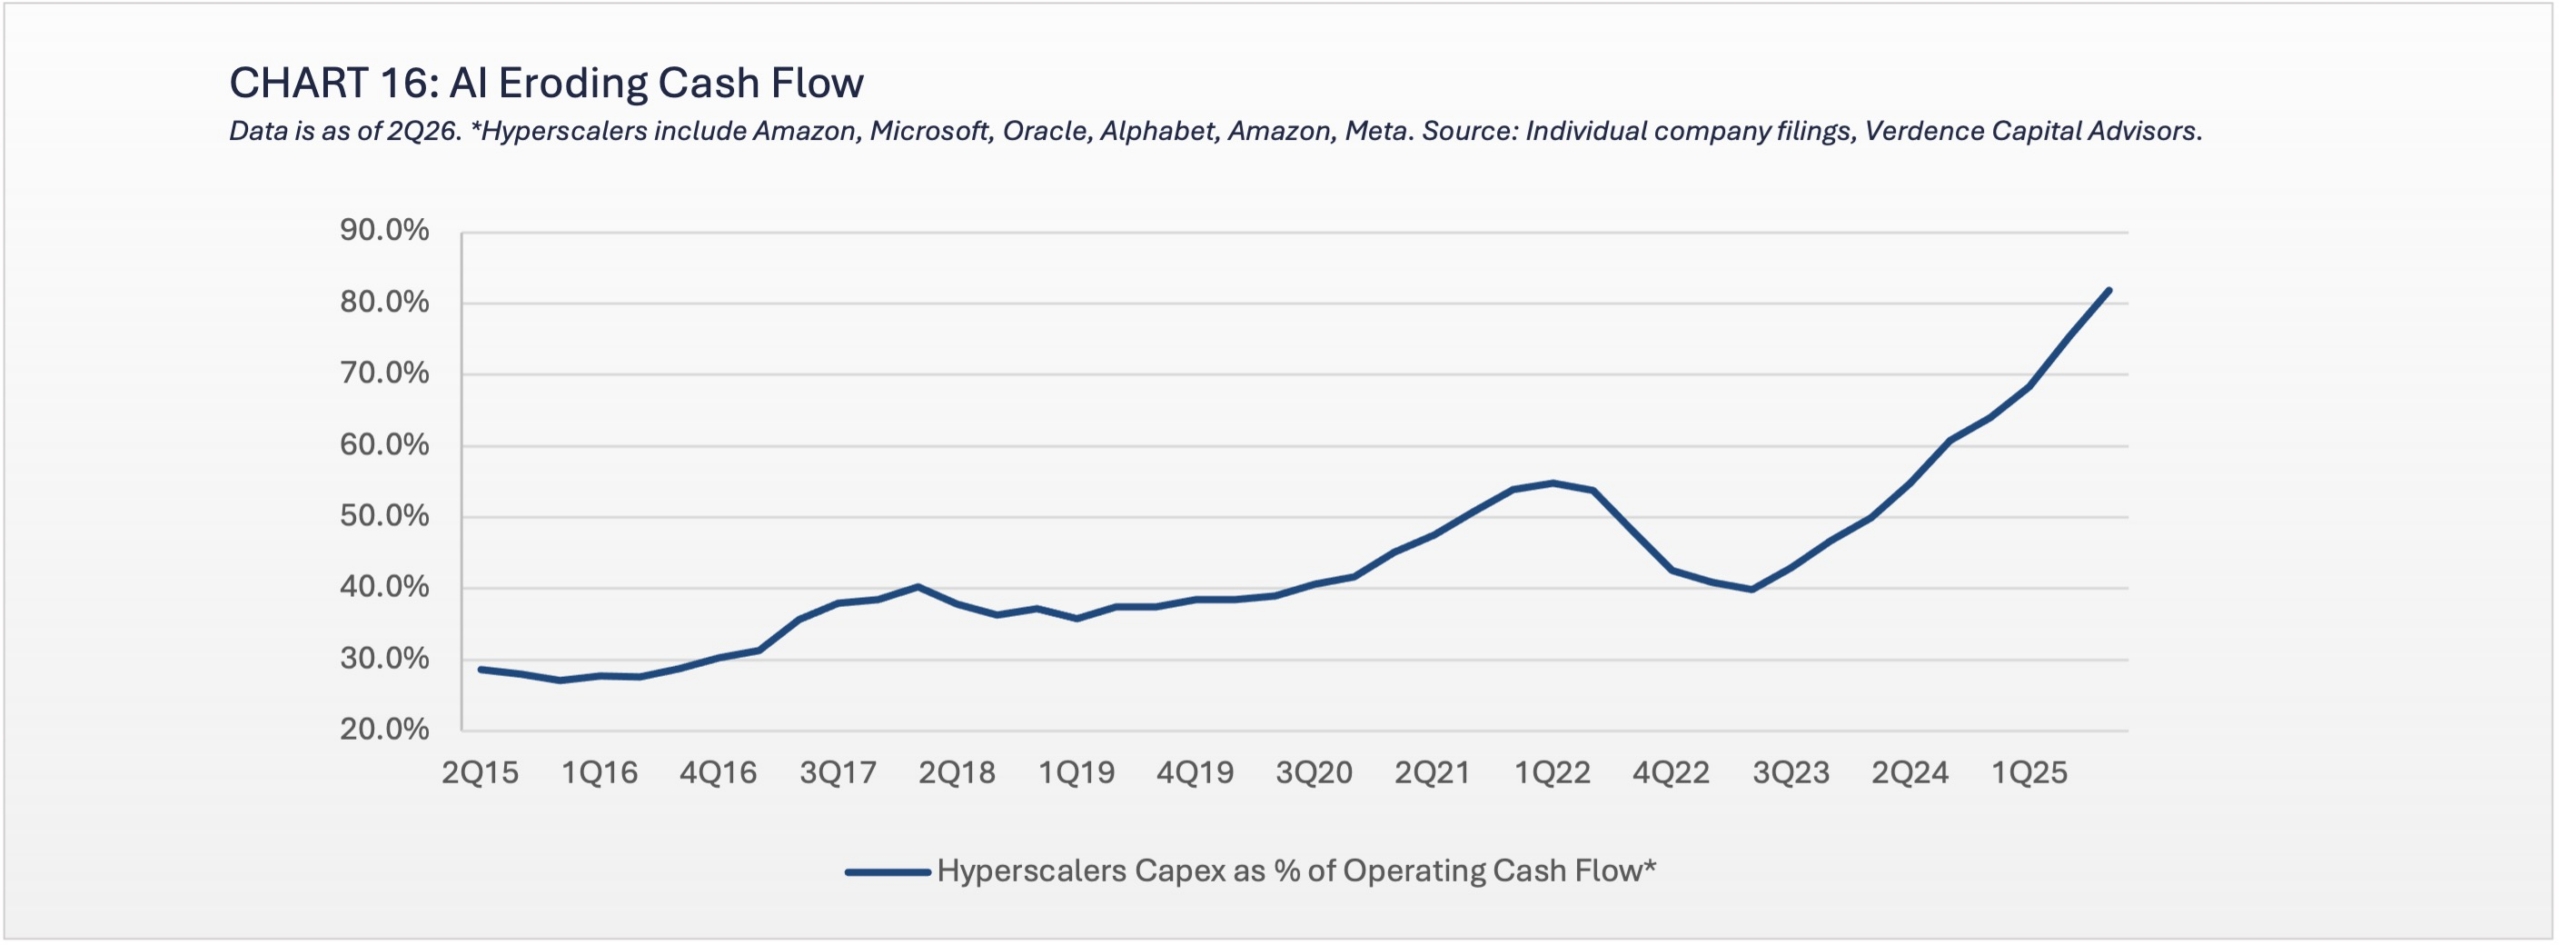
The largest technology companies are spending on AI faster than their businesses are generating cash. PIMCO estimated that AI capex will absorb about 94% of hyperscaler operating cash flow in 2026–2027, up from just 40% in 2023. In fact, when you look at the hyperscalers (i.e. Amazon, Meta, Microsoft, Oracle, Google) their capital expenditures are the biggest portion of their operating cash flow on record. (chart 16).
We believe the looming risks outlined above justify a cautious approach to equities, especially in the large-cap space. However, investors can look outside of the U.S. for opportunities. We realize there are political risks in Europe, and several developed markets are more sensitive to energy shocks because of the wars, but we see opportunities in developed equity markets for long-term investors.
Diversification away from AI concentration.
With technology and communication services making up about half the S&P 500 and driving most of its earnings growth, developed international markets offer heavier exposure to financials, industrials, health care, and consumer staples. That gives investors a way to own global growth without depending as heavily on AI spending pays off.
Policy and reform in Europe and Japan:
Germany’s fiscal shift is a multi-year boost to economic growth. Its €500 billion infrastructure fund should support European industrial and defense companies. In Japan, the move out of decades of deflation justifies a rerating of Japanese equities. In addition, the Tokyo Stock Exchange’s governance campaign that started in 2023 has been showing positive developments. Share buyback announcements have increased to a record high in 2026 (¥16.2 trillion) and could exceed ¥20 trillion for the first time on record.5 Dividends are also on pace to rise to a record high in 2026.6
Equities Bottom Line
While record profits and enthusiasm around AI have powered another strong year for equities, elevated earnings expectations, rising capital costs, and growing competition from bonds leave little room for disappointment. We are modestly underweight global equities, primarily in the U.S. large cap space. However, we remain constructive long term and see attractive opportunities in developed international markets. Valuations are more attractive than U.S. valuations and international developed equities are less dependent on AI earnings, so they offer another layer of diversification.
Alternatives – Uncorrelated Assets in Times of Uncertainty
For qualified investors, alternative investments can perform well in the current climate of elevated inflation and uneven economic growth. For qualified clients that invest in private investments, they are spared the daily volatility seen in public markets and historically have been offered an uncorrelated asset. We believe that one of the more attractive long-term areas of alternatives is in the real asset space (both public and private). Real assets can not only perform well in periods of stubborn inflation but also in periods of infrastructure investment. The infrastructure investment that is occurring due to artificial intelligence (e.g., electricity) and the potential for price appreciation and income should benefit investments in the real asset space, yet recognizing that diversification and active management is important in a period of slowing economic growth.
Private Credit Risks Are Rising
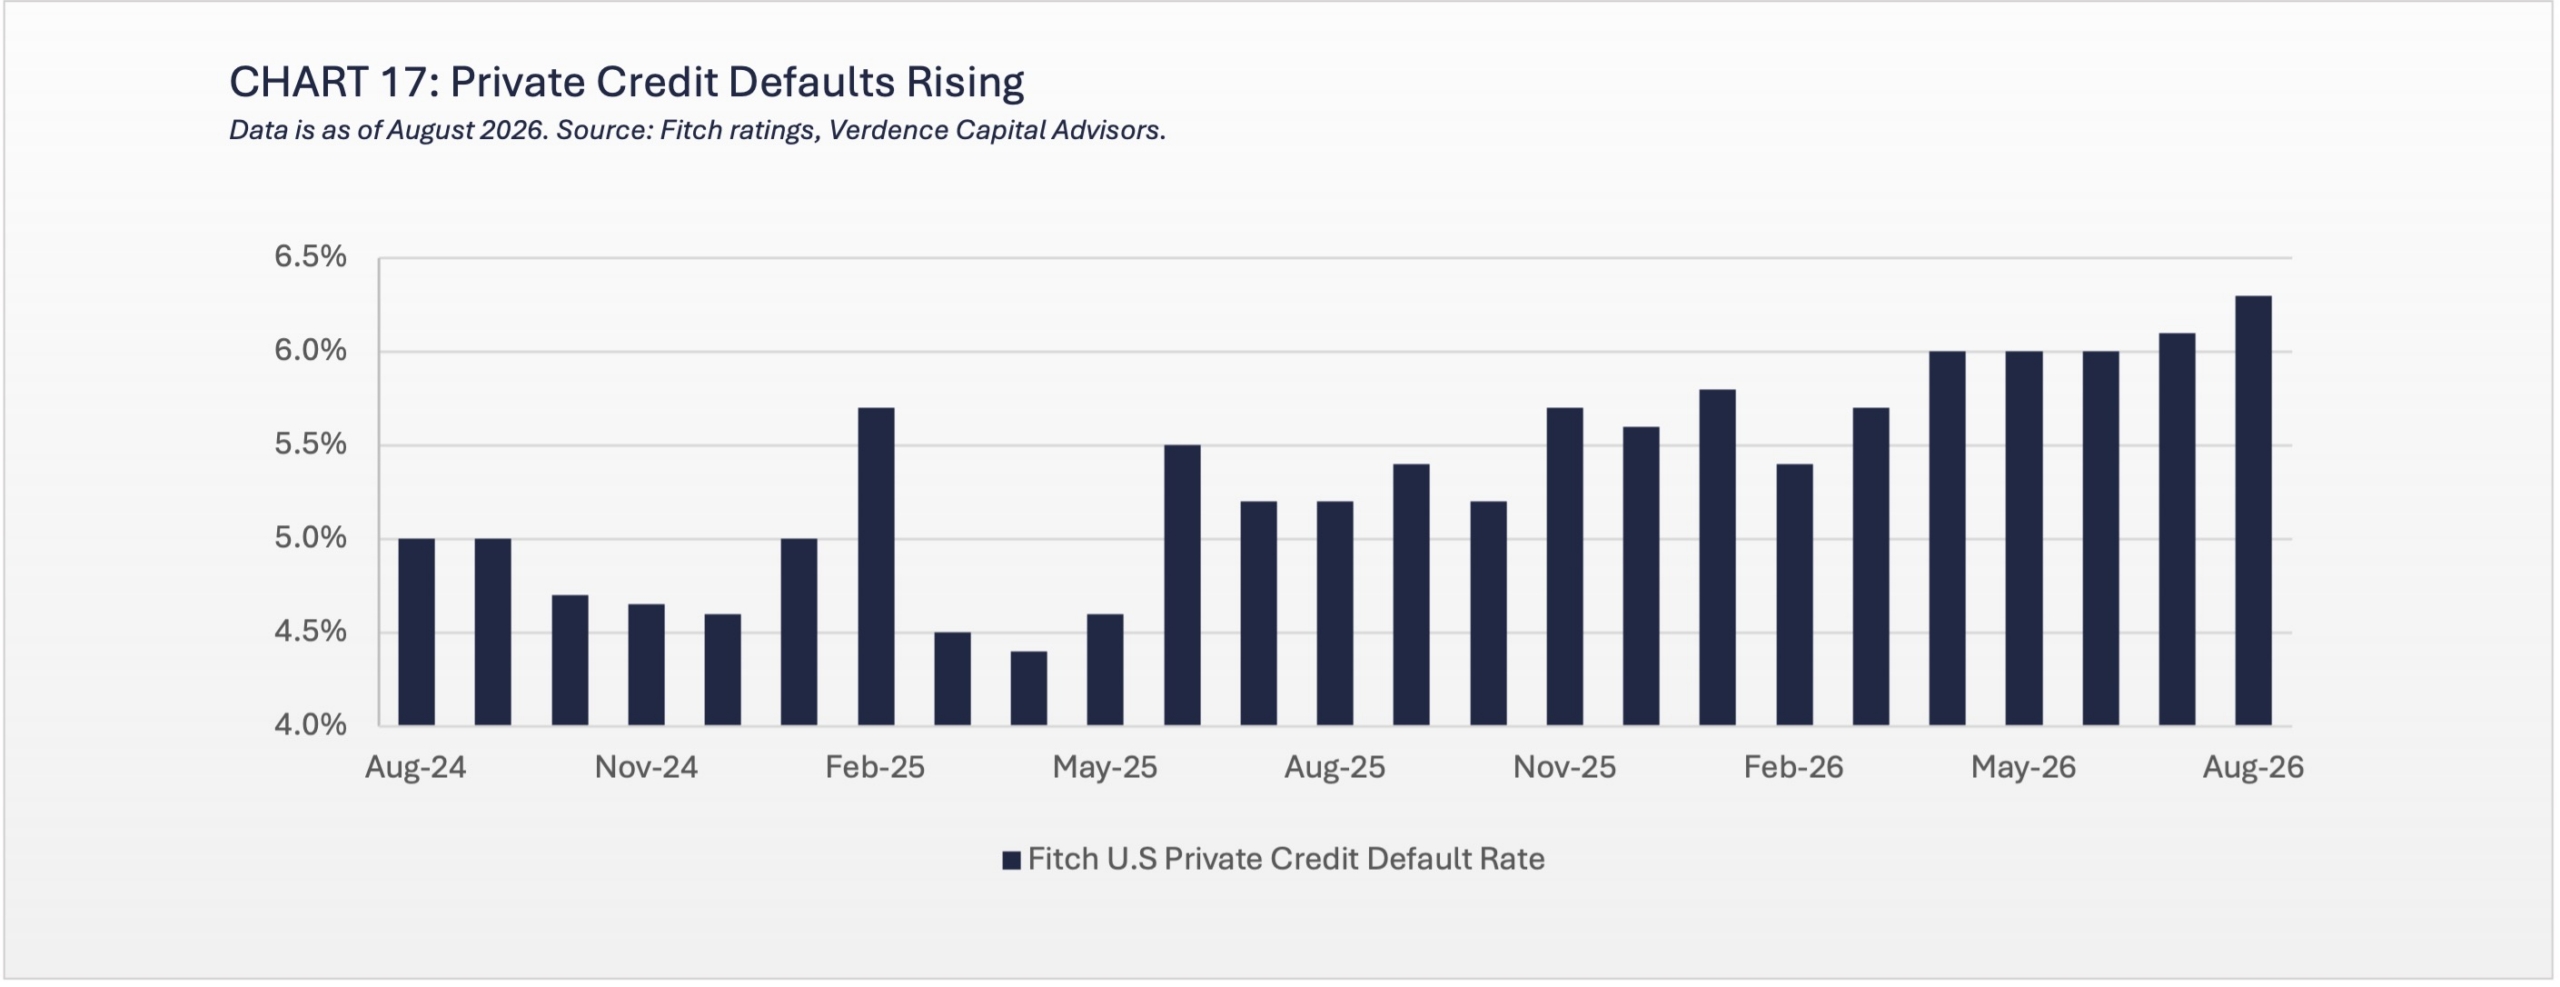
We are avoiding additional exposure to private credit at this time but still believe in the sector for the long run. Private credit has grown substantially in recent years. This is as traditional banks have pulled back lending and investors have demanded yield. However, underwriting standards have weakened and now default rates are rising. (chart 17). Especially in areas where private credit invested heavily in software companies. In fact, default rates may be even higher than they appear. This is as debt has been extended and borrowers have increasingly used the payment in kind feature (pays interest with more debt instead of cash).
Liquidity has also become a major concern. With higher rates making other investments more attractive and defaults rising, investors are seeking to exit semi-liquid credit funds with many funds being forced to limit withdrawals.
Within the commodity space we would focus on a broadly diversified approach which we believe can help protect portfolios in an environment of persistent inflation, supply shocks and rising interest rates. While energy has driven a lot of the price gains in the commodity space, prices are highly volatile and subject to daily changes in headlines. We like gold for the long run but its price is likely to be dictated by moves in interest rates. Since we think there is more upside in yields, there is likely a better opportunity to invest in gold. Commodities offer another layer of diversification and less correlation to other asset classes but a diversified approach is appropriate for the long run.
Alternatives Bottom Line:
For qualified investors, we believe the current investing climate is a good opportunity to look for private investments in the real asset space as well as hedge funds that can help mitigate the volatility investors experience in their public market portfolios. Within the public markets, we like commodities as a real asset but are strongly recommending a well diversified approach. We would consider focusing on natural resources and infrastructure as a long term investment.
There will be winners and losers during this AI boom
Verdence View:
The global economy has been able to absorb an energy shock, higher interest rates and stubborn inflation. We expect capex spending on AI to continue to be a source of economic growth. But we think the consumer is getting more strained. As a result, we expect more uneven and even slower growth in the coming quarters but not a recession. With inflation broadening and the Fed likely to keep tightening, we favor shorter duration fixed income exposure. We would also focus on high-quality bonds as the credit environment is weakening.
We are constructive on global equities for the long run but think it is prudent to be underweight U.S. large cap equities. Earnings may be too optimistic, the cost of capital is rising, profit margins have likely peaked, and investors are demanding results for the excessive capex spending. It is important at this stage of the economic and earnings cycle for investors to focus on active management. There will be winners and losers during this AI boom, making a thorough bottom-up analysis critical to investing success.
As always, if you have any questions about our perspective, please do not hesitate to reach out to your advisor.
Author: Megan Horneman | Chief Investment Officer Past performance is not indicative of future returns
- Processing Power: The Effect of Data Centers on Wholesale Electricity Markets – Research Dept. Working Paper No. 2606 – Dallas Fed
- The AI buildout comes to the bond market | Vanguard
- https://advantage.factset.com/hubfs/Website/Resources%20Section/Research%20Desk/Earnings%20Insight/EarningsInsight_101626.pdf
- Big Tech AI Capex Hits $730B in 2026, Amazon Raises to $220B
- Japan share buybacks soar past $100bn, driven by Sony, Hitachi – Nikkei Asia
- Japan dividends heading to record high on chip, AI gains – Nikkei Asia
