
The U.S. economy powered through the variety of headwinds that it was handed in 2025. Despite the longest government shutdown on record, the worst annual job creation since the pandemic and a massive overhaul of global trade, the U.S. economy delivered ~4% growth in the second and third quarter and is on pace to grow ~2.0% for the year.
Fears that tariffs would cause a disruption in the expansion proved unfounded. In fact, after a short-lived contraction, net exports saw the best two quarters of contribution to GDP since 1980 (2Q & 3Q). The consumer continued to spend despite persistent inflation, rising unemployment, sluggish real income and consumer confidence that hovered near record lows.
Furthermore, businesses continued to pour money into spending on equipment to keep up with the AI revolution.
Global equities celebrated the surprisingly strong economic growth and accommodative monetary policy seen in many major global economies. The MSCI AC World Index posted its third consecutive year of double digit returns but 2025 was a year that investors looked beyond the tech heavy U.S. markets to find value. The MSCI AC World Index excluding the U.S. outperformed the S&P 500 by the most since 2009 led by gains in the emerging markets and Europe.
Accommodative monetary policy seen around the world helped bonds post their third consecutive year of gains. However, it was global bonds, particularly the emerging markets, that led the performance for bond investors.
Precious metals were the biggest winner in 2025 with gold prices making more than 50 fresh record highs for the year. A weak U.S. dollar, trade tensions, rising global debt and geopolitical events led gold to post its best annual return since 1979 and silver prices to more than double.
As we move into 2026, our base case is that economic expansion will continue, but admit it is on a fragile footing with several risks worth monitoring.
Supportive factors include a combination of:
- past accommodative monetary policy,
- a generous tax package in the U.S.,
- fiscal stimulus around the world,
- easing trade tensions and
- continued spending on artificial intelligence.
We are optimistic, not complacent about the risks that may challenge our view. Investors should remember that the economy is not the stock market. Reflation risks may be under-appreciated and could impact interest rates and equities that are sitting at or near record highs.
An AI overbuild, policy uncertainty and geopolitics also pose risks. In addition, we are watching the consumer closely given tepid real income growth (Chart 1) and a labor market that is structurally changing due to AI and changes in immigration. Below we outline our major themes for 2026 from an economic and investment perspective.
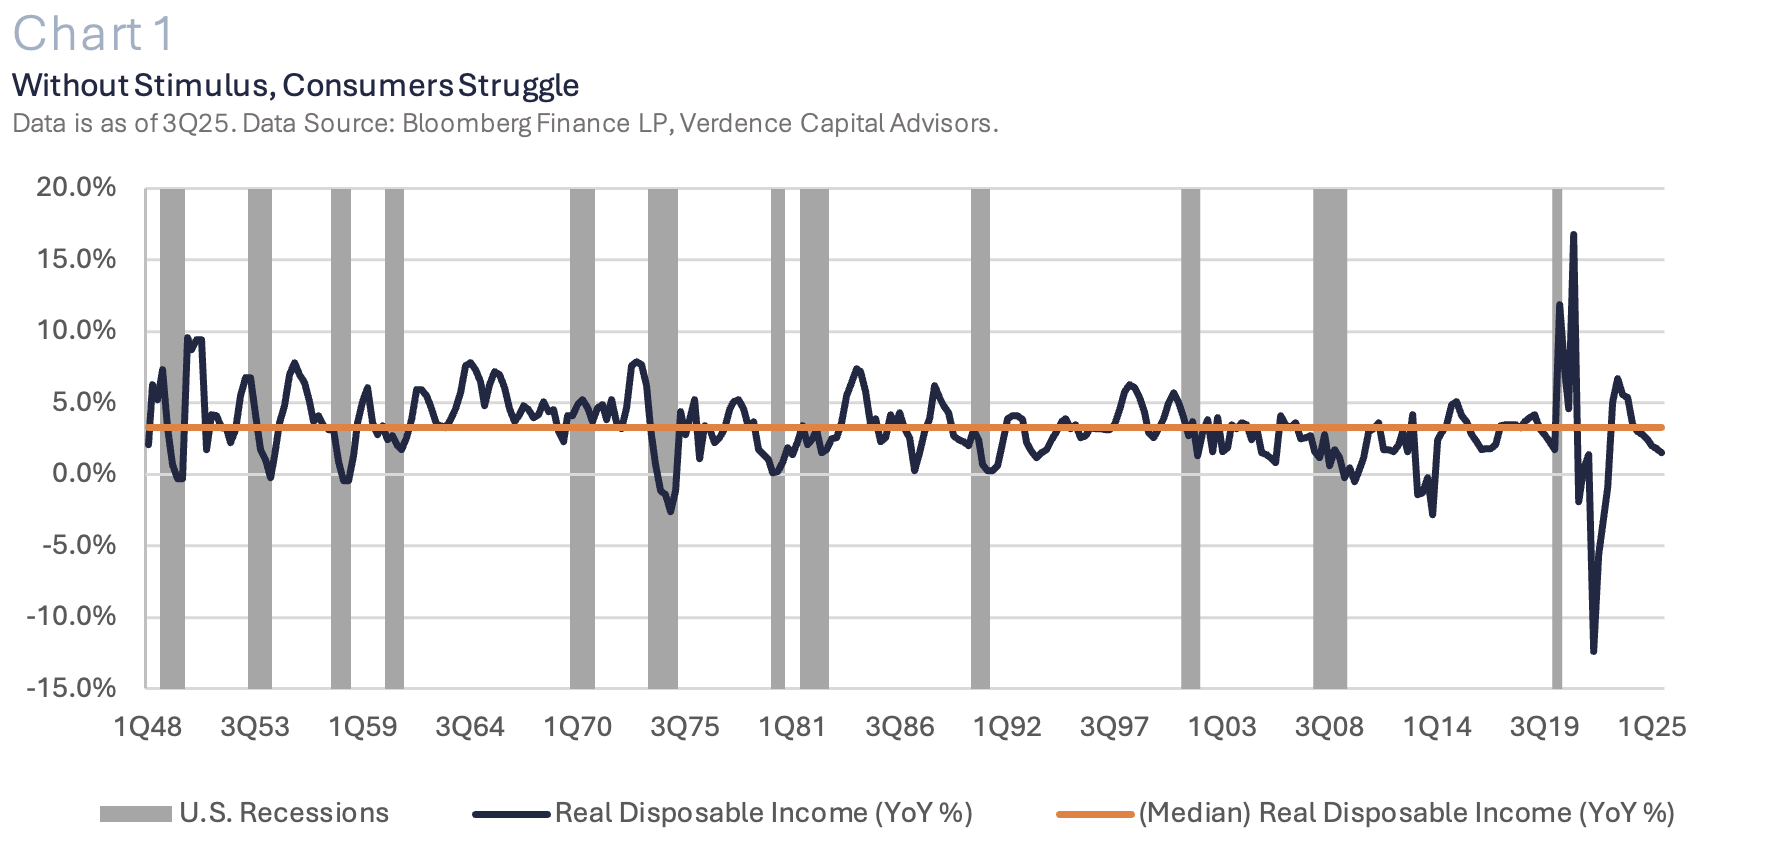
While consumer confidence has been hovering at levels that typically coincide with a recession, consumer spending continues to hold up.
Theme 1: Expansion to Continue with Little Room for Error
The U.S. economic expansion should continue in 2026 but is highly vulnerable to shocks.
It is important to remember that while many Americans are struggling and the economic pain is real, the main measure of economic growth (i.e. Gross Domestic Product or GDP) is a basic math equation. GDP adds up all the personal, business and government spending in the U.S. and net exports (imports – exports).
Our base case that economic growth will be positive in 2026 is attributed to pro-growth government policies (e.g., taxes) and ongoing capex spending (e.g., AI spending).
In addition, from a global perspective, we are seeing stimulative policies in many major global economies (e.g., Germany, Japan, China) that should support global growth. Our main supporting factors include:
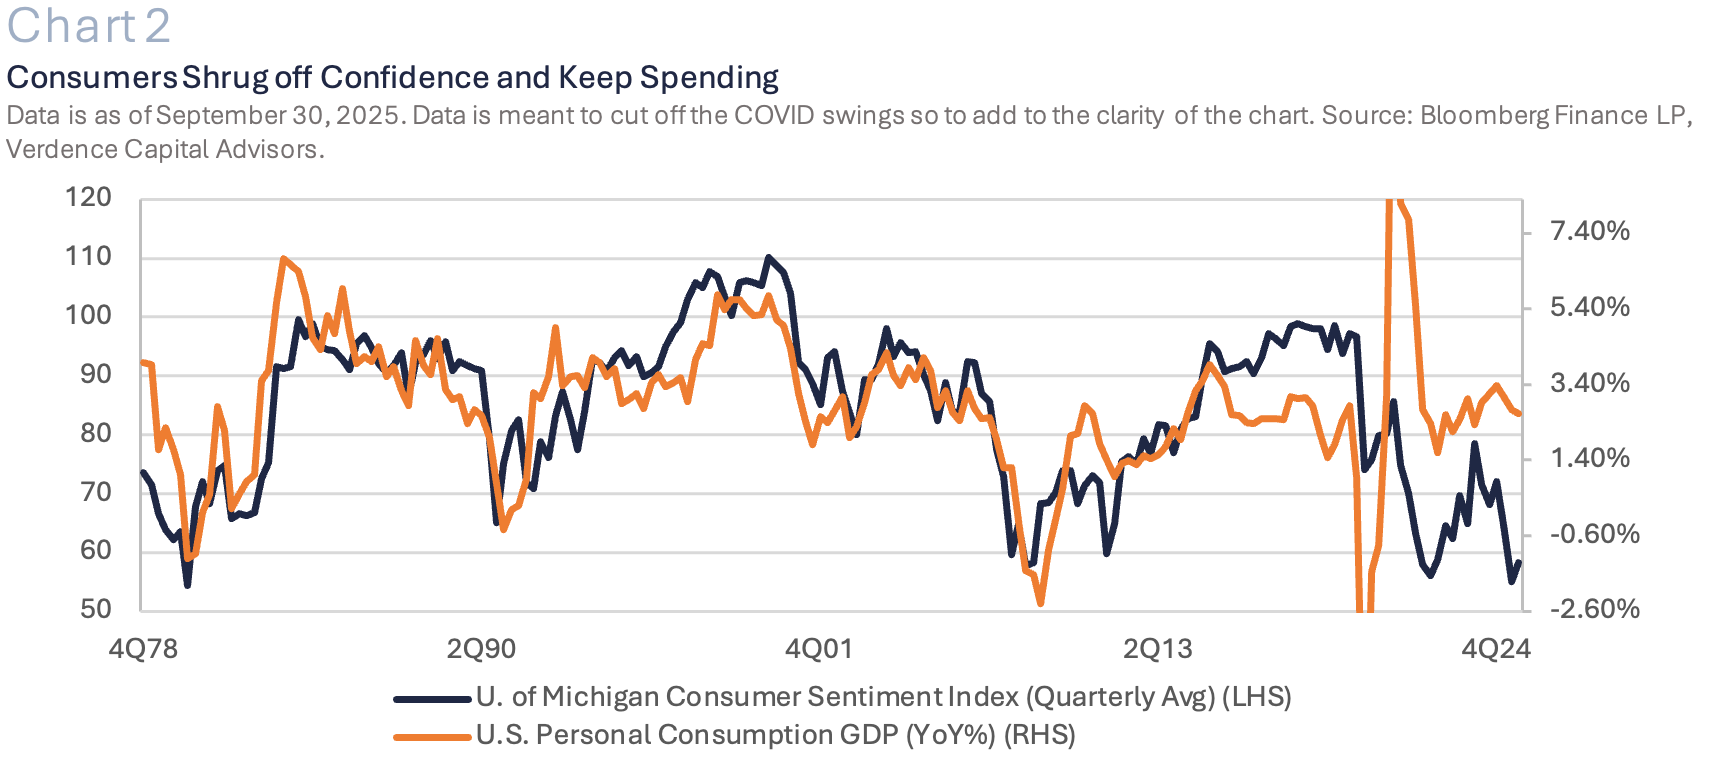
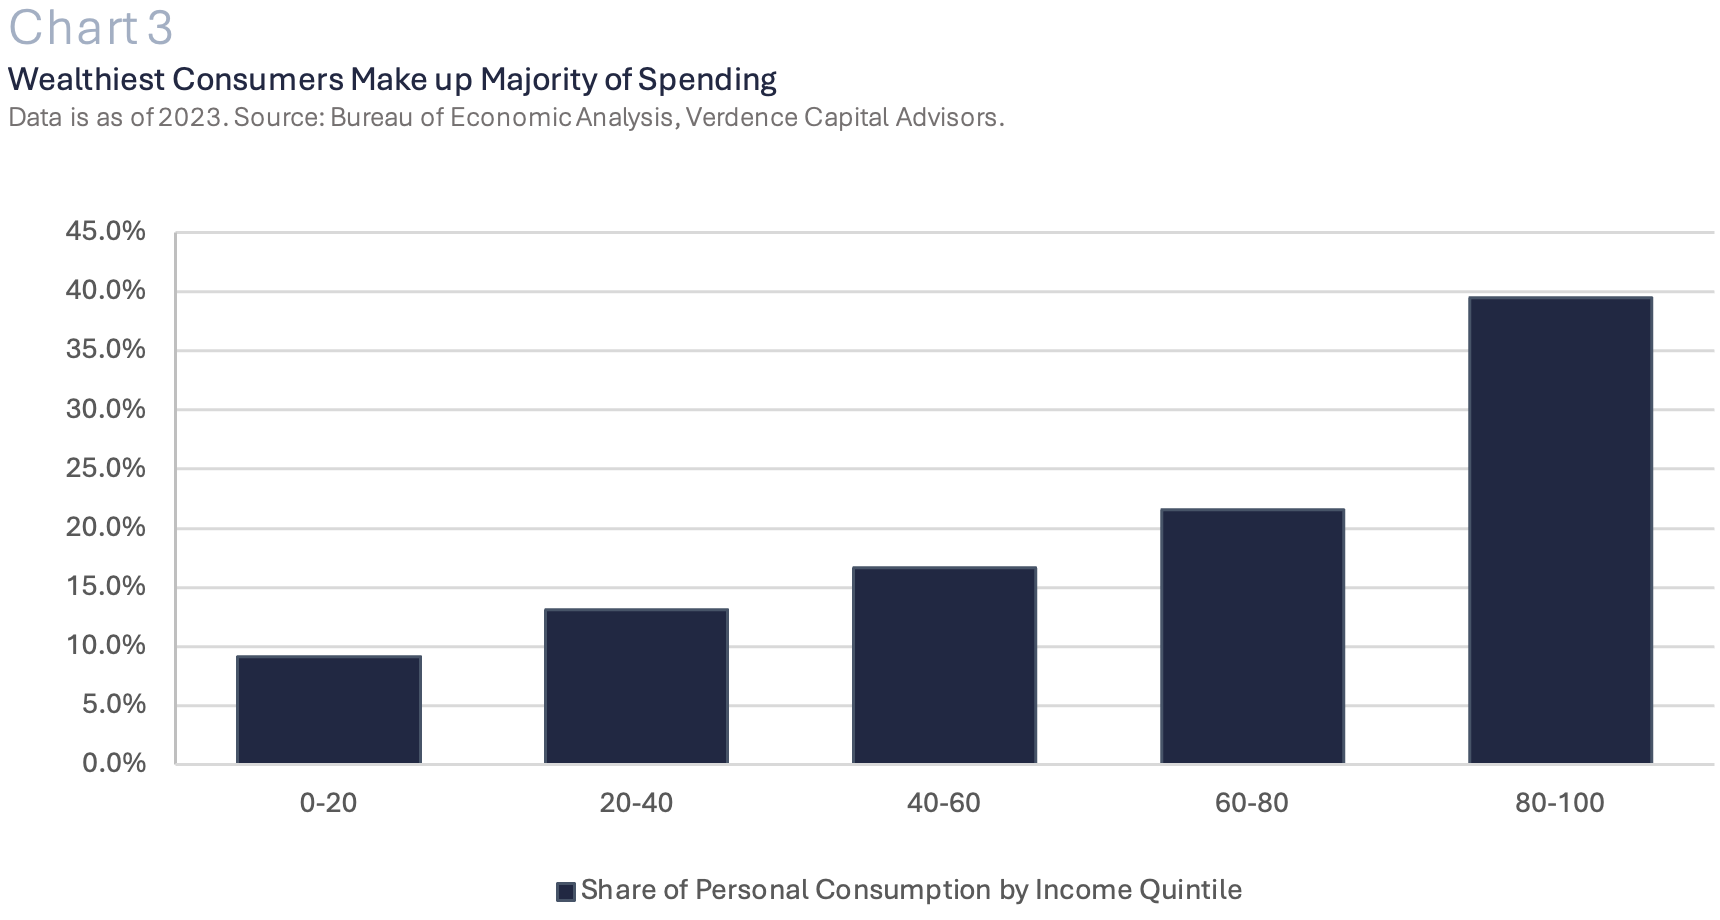
- Consumer Offered a Much-Needed Lifeline: The U.S. consumer has been one of the most bifurcated segments of the U.S. economy in 2025. While consumer confidence has been hovering at levels that typically coincide with a recession, consumer spending continues to hold up. This contrasts with history, which shows that when confidence slips, spending falls as well (Chart 2). This may be partly due to the rise in asset prices (e.g., stocks) that does not benefit every segment of the U.S. economy. For example, in a recent Gallup Poll, 87% of those surveyed in the upper income level ($100K+) reported having investments in the equity market while only 28% making less than $50K reported owning equities.(1) In addition, the wealthiest 20% of U.S. households make up 40% of total personal consumption in the U.S. (Chart 3)(2). While there has been debate about the “One Big Beautiful Tax Bill” and who it may benefit the most, from an economic perspective the tax bill offers benefits across all income levels starting in the first half of 2026. It is estimated that tax refunds will increase by almost $100 billion this tax season with the average tax refund estimated to be ~$1000 more than last year (may widely vary depending on taxpayer).(3) The no tax on tips and overtime provisions may also help some low-income earners that have been primarily saddled with stubborn inflation and a slowing labor market. The increase in the standard deduction and child tax credit and the lower tax rates being made permanent is also supportive across income levels.
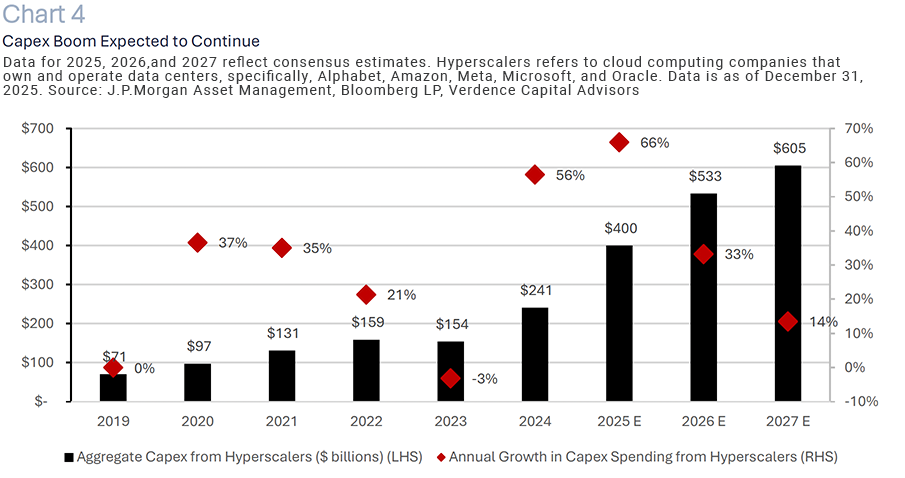
- AI Spending: There is no denying that the evolution of artificial intelligence will change many aspects of our lives and structurally change things like employment and productivity. In addition, the spending on equipment and intellectual property rights has a direct impact on the calculation of GDP. Capex spending is likely to continue through 2026 (albeit at a slightly slower pace) which is additive to economic growth. After the massive increase in spending in 2024 and 2025, spending by the major hyperscalers is expected to grow double-digits in 2026 and 2027 to reach ~2.5% of GDP by 2027. (Chart 4).
- Global Stimulus Supportive: One of the indirect impacts of the reorder of global trade and ongoing geopolitical tensions is that many major economies are focusing on their domestic economies. Germany relaxed the constitutional limit on borrowing and implemented a multi-year infrastructure and defense spending plan, which is estimated to add ~1% to German GDP in 2026.(4) At the end of 2025, Japan announced the largest fiscal stimulus plan since we witnessed COVID era spending. The plan includes spending on AI, defense, tax cuts and subsidies to ease the rising cost of living. China is focused on boosting household consumption and investment in technology and manufacturing. Chinese consumers are being incentivized to trade in goods for new ones, and the commerce minister has insinuated plans that will encourage spending on experiences (e.g., travel, dining etc.) and “Shopping in China” campaigns.(5) Despite the tariffs, a strong global economy benefits the U.S. as well.
Economy Bottom Line:
We acknowledge, and are closely monitoring, the risks that could challenge our base case scenario. Politics are expected to continue to be a source of headline angst with geopolitical tensions increasing, the supreme court set to vote on Trump’s tariffs, midterm elections in 4Q and a likely new Fed Chairman (in 2Q).
In addition, we are still trying to navigate through a variety of economic indicators that have been distorted because of the longest government shutdown on record to get a clearer picture on the labor market and inflation. These factors are likely to be a source of economic volatility and may cause some short-term data dislocations. However, these factors are not expected to derail the economic expansion in 2026.
Theme #2: Federal Reserve – Stop and Go Can go Both Ways
We realize that recent headlines about changes at the Federal Reserve in 2026 open another layer of uncertainty for investors given how outspoken the new administration has been. We stand by our view in our most recent white paper, “Understanding the Fed Dynamic,” (December 18, 2025) where, despite the media headlines, we do not see a risk to the Fed’s independence, regardless of who takes the Chairman seat. The Fed will continue to focus on its dual mandate of maximum employment and stable prices over political bias. Central bank independence is vital to a well-functioning banking system. Unfortunately, we think that investors are overconfident about the Fed’s flexibility in 2026. It is difficult to believe the consensus view that all the stimulative measures that are being taken globally, changes to trade policies, continued economic growth and recent accommodative monetary policy will not cause inflation scares in 2026. This risk of reflation can easily overshadow cooling in the labor market and take over as the Fed’s top priority. Especially since the committee is still very divided with many voting members voicing their concern about inflation risks.
As a result, we think the Fed will likely remain on hold in 2026 and there is a higher chance of a rate hike in late 2026 or early 2027 than there is for another cut. We admit the labor market is slowing and structural changes are taking place with the implementation of AI. However, with the decline in immigration in the U.S. (Pew Research Center estimated ~1.5 million decline in immigrants in 1H25), the U.S. economy can have a period of slower job creation without a massive increase in the unemployment rate.(6)
There is a higher chance of a rate hike in late 2026 or early 2027 than there is for another cut.
Theme #3: Global Equities—The Stock Market is not the Economy
While we expect the economic expansion to continue in 2026, it does not mean it has to translate into the easy equity returns that investors have been accustomed to. We are entering 2026 recommending an underweight global equity allocation (to the benchmark) as it is increasingly difficult to justify prices at these levels.
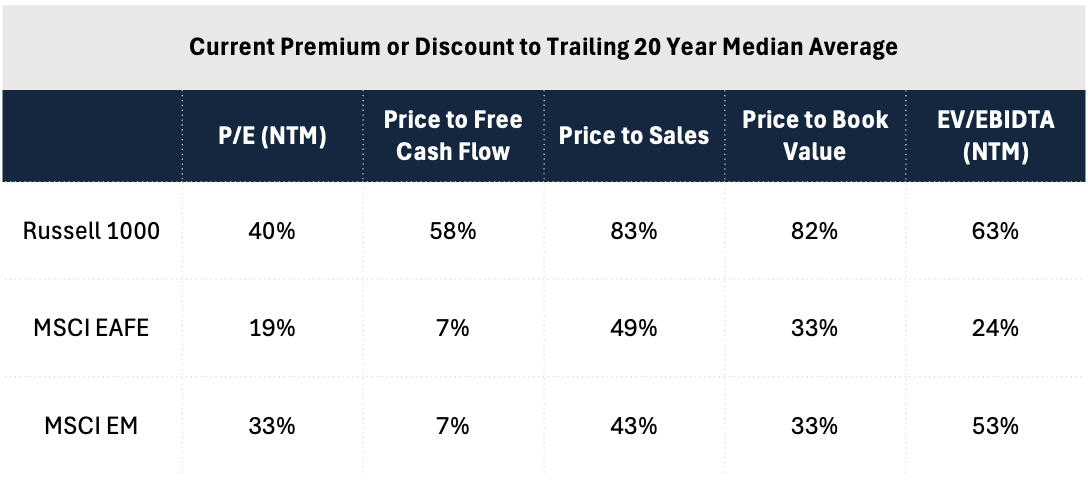
Many major global equity markets are already at record highs and valuations are trading at steep premiums across a wide variety of metrics. (Table 1).
Valuations at current levels fully reflect the continuation of the economic expansion and the euphoria over AI while overestimating the ability for central banks to continue cutting rates in 2026. In addition, 2026 will be a year where investors will want to see the massive AI capex spending translate into earnings to warrant the heightened valuations (especially in U.S. tech).
Therefore, investors should get used to more volatility, less multiple expansion and returns to be dependent on earnings growth. Quality over momentum strategies and active over passive management will be key themes as we move through 2026. Below are some key equity themes for 2026:
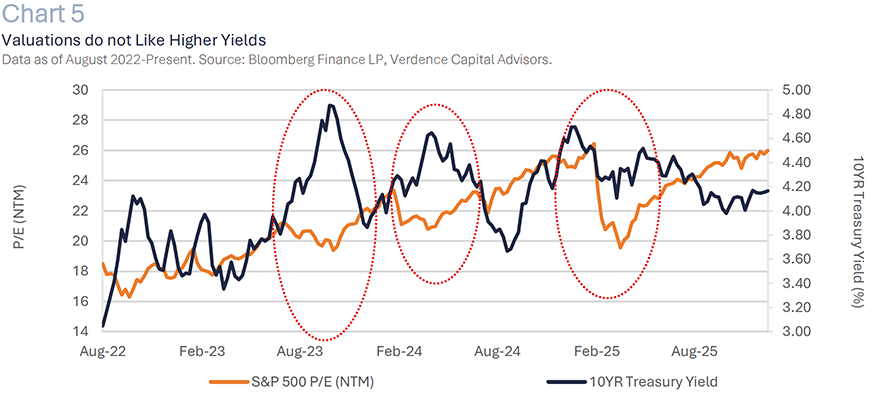
- High multiples and higher interest rates do not mix well: We think the expectation for lower interest rates in 2026 is too optimistic. Instead, inflation, fiscal stimulus and debt fears should keep upward pressure on both short and long-term rates. Going back to 2022, when the Fed started raising interest rates, we have seen a strong relationship between the S&P 500 price to earnings multiple and the change in 10-year Treasury yields. As yields rise, the S&P 500 price to earnings multiple falls. (Chart 5).
Table 1
While we may be cautious about growth in the near term, we remain positive long term on the U.S. economy.
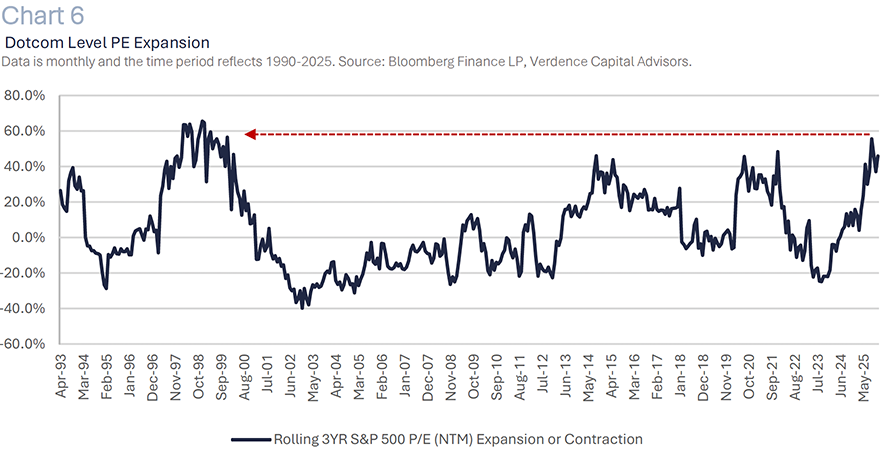
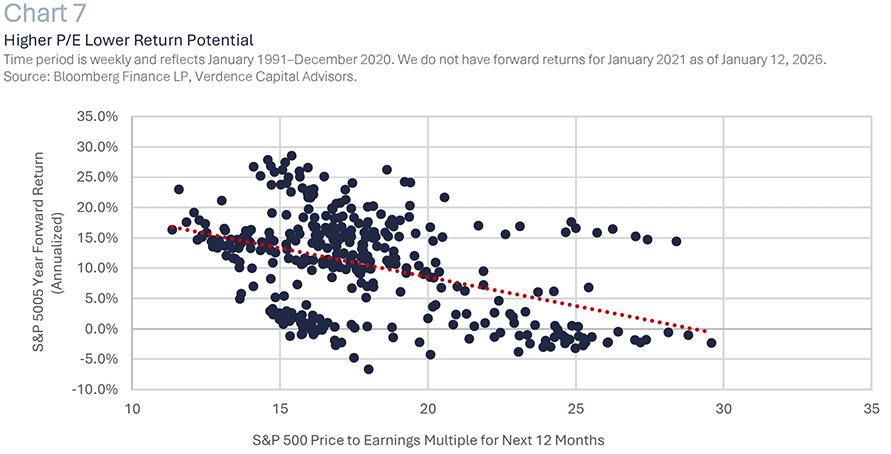
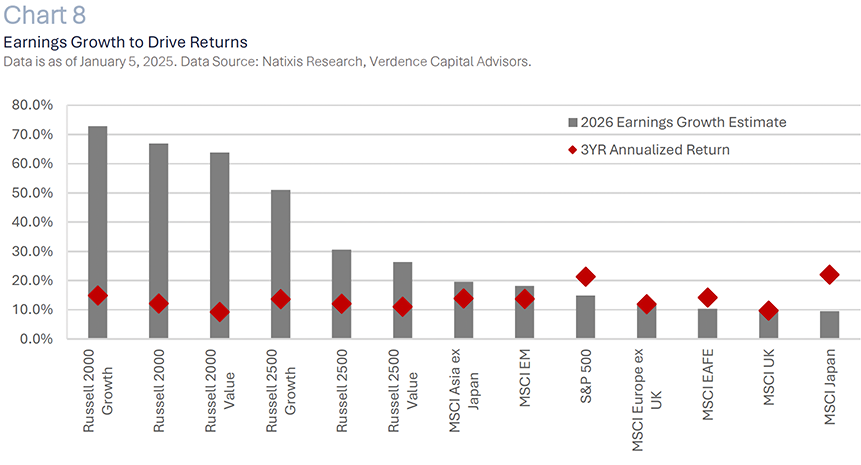
- Earnings growth over P/E expansion: The price to earnings multiple expansion we have witnessed in recent years is similar to what we saw in the lead up to the dotcom bubble. (Chart 6). As a result, we remain concerned about areas of the global market (specifically in the U.S.) that are trading at a premium and have high P/E multiples (technology/growth). History suggests that the higher the P/E multiple, the lower the forward five-year returns are for large cap U.S. equities. (Chart 7). We believe there is little to no catalyst to support P/E expansion to continue at this pace. Especially absent additional Fed rate cuts and reflation risks. Instead, earnings growth will be important for returns. While most of the global equity market looks expensive, there are some areas that have strong earnings growth estimates for 2026 but have lagged the expensive U.S. large cap space, offering value for a long-term investor (small and midcaps). (Chart 8).
- Quality over momentum: A momentum trading strategy has outperformed a quality trading strategy in recent years. In the trailing two years ending in 2025, a momentum ETF outperformed a quality ETF by ~20% (or about 10% a year).(7) We think this trend will change in 2026. Momentum strategies tend to outperform early in a cycle when prices are rising, risk appetite is strong and technical indicators favor ongoing upside. However, as we move through the economic cycle, history shows that investors start to prefer high quality stocks with steady earnings, less volatility and strong free cash flow.
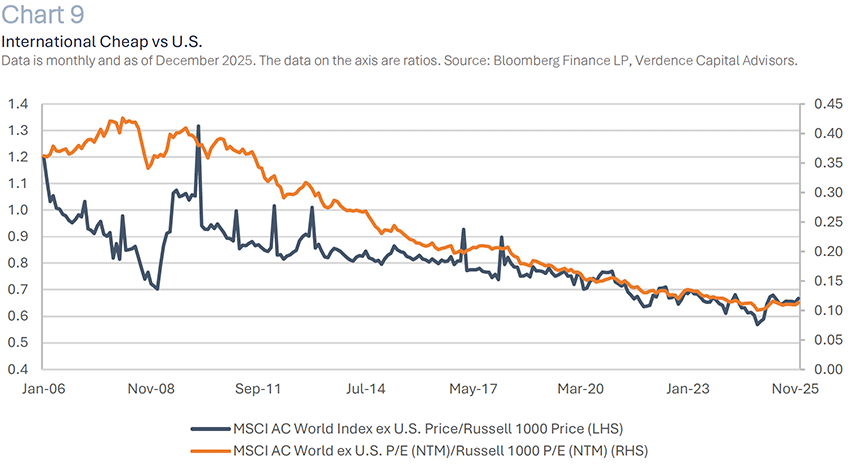
- International expensive but more attractive than the U.S.: Developed international equities solidly outperformed the U.S. market in 2025 and we believe there is room for this rotation to continue. While equities in the developed and emerging markets are expensive relative to their own history, they are historically cheap compared to the overvalued U.S. market. The MSCI AC World Index excluding the U.S. is trading at a historical discount from a price perspective and valuation perspective compared to the U.S. markets (i.e. Russell 1000). (Chart 9).
Global Equities Bottom Line:
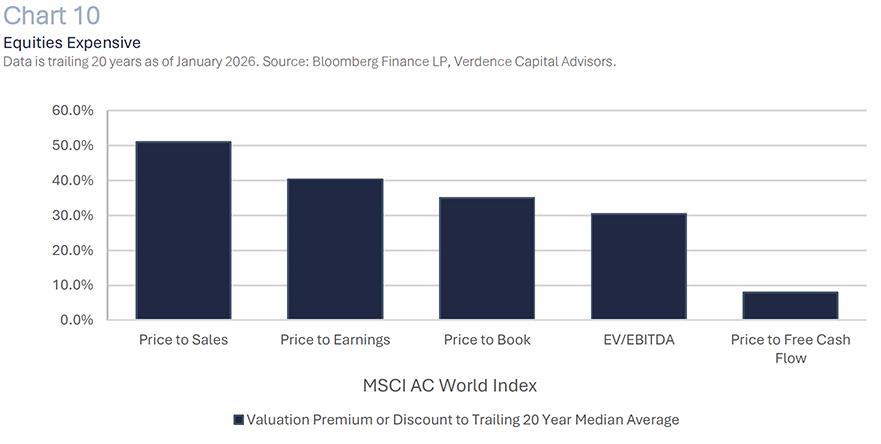
By nearly every metric we monitor, global equities look expensive from a valuation perspective. (Chart 10). While earnings growth looks solid, we must remember that these are estimates that can change quickly, especially in the sectors that are tied to AI.
As long-term investors we would not completely avoid equities, but we would be underweighting the most expensive areas of the U.S. market compared to our benchmark. We would be solidly underweight U.S. large cap growth which is the most susceptible to disappointment on the Fed’s ability to cut rates and heightened earnings expectations.
Momentum strategies will be challenged this year as investors move away from stocks with unrealistic valuations that have been driven by euphoria instead of fundamentals.
Within our global equity exposure, we prefer areas of the global equity market that have lagged the AI driven boom.
Despite the outperformance recently, this includes international equities and small and midcap stocks. Lastly, we recommend adding hedging strategies within your overall portfolio. This can be accomplished by using liquid alternatives or for qualified investors, using illiquid hedge fund options.
Global debt continues to soar and is estimated to be about $250 TRILLION (in USD) and just above 235% of global GDP.
Theme #4:Global Fixed Income – Growing Debt, Shrinking Tolerance
Global fixed income has continued to benefit from central banks easing monetary policy, geopolitical tensions and inflation that has decelerated from multi decade highs. In 2025, the Bloomberg Global Aggregate Index posted its best annual return since the pandemic. In addition, the rally in high yield, investment grade and especially emerging market bonds delivered solid returns. This has occurred at a time when global debt continues to soar, with estimates near $250 trillion (in USD) and just above 235% of global GDP.
This is not just a U.S. phenomenon. Many countries in Europe (e.g., France, Italy, Greece, and Spain) continue to be plagued with excessive debt to GDP levels and Germany just reformed their debt limit to be able to institute fiscal stimulative measures. We have also witnessed debt levels rising in emerging markets (e.g., China, Brazil, and Mexico). While this has been a growing problem for many years, we are increasingly concerned about the fixed income sector given these debt dynamics.
Bonds play an important role as a portfolio diversifier in our opinion, but find long term bonds are less appealing. In addition, we do not see reflation risk being reflected in broad interest rates at current levels. We would recommend being underweight fixed income duration compared to the benchmark and being selective within that exposure.
- Reduce duration to underweight. We recommended holding a neutral duration (to our benchmark) in our fixed income portfolios as the Fed has been cutting rates; however, we believe it is time to shorten duration. Our expectation that the Fed cannot cut rates as much as the market expects warrants a shorter duration in our portfolios. In addition, we expect inflation to be more problematic than the markets are pricing in. Historically, the 10-year Treasury yield follows closely with the year over year change in nominal GDP (with exceptions in COVID). Therefore, even if inflation can decelerate to 2.0-2.5% and the economy grows 2.0-2.5% in 2026, that would suggest the 10-year yield should be closer to 4.5-5.0%.
- Cut exposure to spread related products. We have historically believed that some allocation to emerging market bonds offers investors long term return potential. In 2025, emerging market bonds posted their best annual performance since 2019. Declining yields, globally, improving inflation dynamics, a reach for yield and weak U.S Dollar benefitted emerging market bonds. In fact, the extra yield investors earn to hold emerging market bonds reached the lowest level since the lead up to the Great Financial Crisis. (Chart 11). Emerging market bonds are now as expensive, if not more, than high yield debt so we believe in cutting the allocation. In addition, they generally carry a higher duration which is at risk from the volatility we expect in interest rates in 2026.
Fixed Income Bottom Line:
Bonds will always serve the purpose of portfolio diversification. However, after three years with a neutral duration to our benchmark, this year warrants us reducing that duration to be underweight. The chance for higher yields are high given the risk of inflation scares, global diversification away from Treasuries and worsening fiscal deficits, globally. We are also more defensive from a credit perspective, given that high yield and emerging market bonds are trading at levels that have not been seen since the lead up to the Great Financial Crisis.

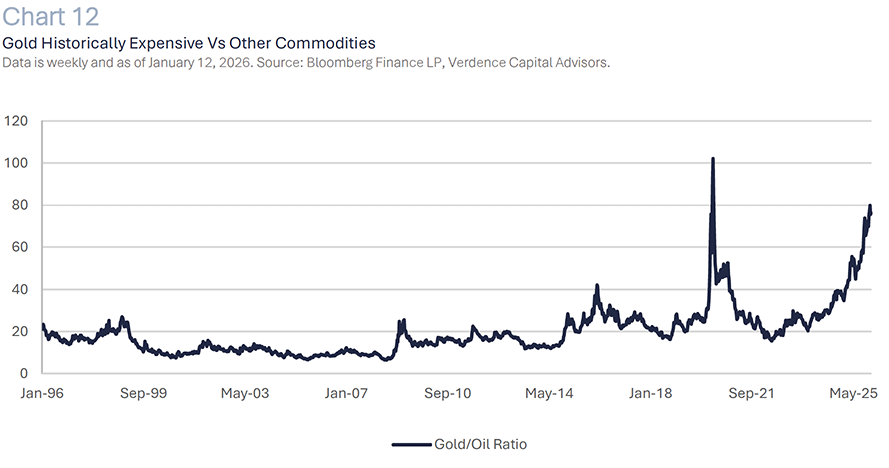
Gold is trading at a substantial premium compared to many other commodities… gold compared to oil is trading near the highest level seen in at least the past 30 years.
Theme #5: Alternatives—Uncertainties’ Layer of Diversification
Alternative investments come in many forms but serve the purpose of diversification, especially when the economy and valuations may be at a crossroads. We believe in alternatives in the liquid and illiquid space to protect investors from reflation risk and valuation risk in the public market.
For qualified investors, illiquid alternative investments can perform well in periods of stretched public market valuations and when inflation is a concern. On the private side, managers have more flexibility and time to be able to find and make good long-term investments. Qualified clients that invest in private investments are spared the daily public markets volatility and historically have an uncorrelated asset with robust risk adjusted return opportunities.
Not only are alternatives good for an added layer of asset class diversification but, from a vintage year perspective, it is important to have some diversification.
We like private credit but would not add to it at this time as the space is getting crowded and risks are rising. Due diligence is critical in all private investments but especially in private credit.
One of the more attractive long-term areas of alternatives is in the real asset space, in our opinion. Real assets can not only perform well in periods of stubborn inflation but also in periods of infrastructure investment. The infrastructure investment that is occurring due to artificial intelligence (e.g., electricity) and the potential for price appreciation and income should benefit investments in the real asset space, but diversification and active management is important.
We continue to recommend alternatives for qualified investors as a portfolio diversifier.
In the commodity space, multiple factors supported gold prices in 2025 including trade uncertainty, a slowing global economy, burgeoning global debt, geopolitical tensions, a weaker dollar, and diversification away from U.S. assets by many global central banks.
Gold, at current levels, looks to be trading more like a momentum investment than a store of value. In fact, gold is trading at a substantial premium compared to many other commodities and we believe rotation will take place in 2026. For example, gold compared to oil is trading near the highest level seen in at least the past 30 years (aside from COVID). (Chart 12).
Instead of focusing on gold, we are looking for a more diversified portfolio of a variety of different commodities. This should help smooth out returns over the long run from select commodities that may be subject to volatility but also add the diversification benefit of holding real assets.
Alternatives bottom line: We continue to like alternatives in the private (for qualified investors) and public space. Hedging strategies are important for all investors when the risk of a valuation correction is high. In addition, real assets are important for investors in a period where we expect to see inflation scares.
The Bottom Line
We realize that we are in a very uncertain time and investors’ anxiety may be high. We remain constructive on the U.S. economy and global equities for the long run, but we cannot warrant chasing equities at these levels.
We admit that overbought conditions, especially when euphoria emerges with new technology, can go on longer than most expect. That is why discipline is so important.
The overoptimism surrounding economic growth, inflation and interest rates is extreme and susceptible to disappointment.
We will continue to monitor the economy, interest rates and inflation and adjust as we see necessary. In our current view, asset allocation warrants a very defensive stance, with the use of hedging strategies where necessary.
As always, if you have any questions about our perspective, please do not hesitate to reach out to your advisor.
Author: Megan Horneman | Chief Investment Officer Past performance is not indicative of future returns
- https://news.gallup.com/poll/266807/percentage-americans-owns-stock.aspx
- The top 10% of earners drive nearly half of all consumer spending. Is our economy too dependent on the wealthy?
- https://www.kiplinger.com/taxes/tax-refund-alert-bigger-2026-payouts
- Estimates are per Deutsche Bank as of December 15, 2025.
- https://www.chinadailyhk.com/hk/article/626845
- https://www.pewresearch.org/short-reads/2025/12/09/striking-findings-from-2025
- Using the ishares MSCI Momentum ETF vs the iShares MSCI Quality ETF