WEEKLY INSIGHTS

March 17, 2025
Download PDF

Key Takeaways:

  • The devastating Russia/Ukraine war may soon be coming to an end.
  • The war has been detrimental to the region and also extremely costly.
  • The world has felt the impact, specifically from trade volatility.
  • President Trump has been negotiating a peace deal for the countries.
  • A long-term agreement may take more time to broker.

Updates on the Russia/Ukraine War

While Russia and Ukraine have been in a conflict for more than a decade, the full fledged Russian invasion of Ukraine began just over three years ago (February 24, 2022). It is believed that more than one million are now dead or injured over the last three years.1 Russia occupies ~20% of Ukraine and the war has impacted both country’s economic growth, inflation and their ability to trade. Recently, President Trump has been trying to negotiate a peace deal between the two nations to bring an end to the costly war. The situation remains very fluid and the complexity will likely prolong any extended resolution. In this weekly, we look back over the past three years and what the war has done to the global economy, and also provide an overview of the negotiation progress as it stands today.

  • Costs of the war: The economic impact of the war is one that will likely continue to be felt globally for quite some time. Economic growth (i.e., GDP) in Ukraine is likely to slow to 3.2% in 2024, from a +5.3% reading in 2023, as damage from Russia’s invasion and electricity disruptions continue to rattle the country.2 Pre-invasion, Ukraine had a total GDP of ~$200 billion. By the end of this year, it is estimated the total economic cost of the war (to Ukraine) will be ~$120 billion in cumulative loss in GDP and ~$1 trillion in damage to infrastructure.3
  • World economic impact: Low- and middle-income countries have been impacted due to rising food prices. These countries typically have a higher demand for wheat, which are key exports out of the Russia/Ukraine region. Wheat prices have fallen drastically since their 2022 peak (~54%), which has been beneficial for countries that rely on the crop. Any continued fighting could put increased strain on export capabilities.
  • US impact: Financial aid has been provided by many Western countries, including the U.S., trying to support the Ukrainian military. The U.S. has committed ~$128 billion to Ukrainian efforts, or roughly 0.55% of GDP.4 President Trump has wanted to stall some of this aid, as he feels European nations specifically have not provided an equal amount of support.
  • Bargaining a peace deal: President Trump has been negotiating a ceasefire proposal to end the war in Ukraine. A contentious meeting between Ukrainian President Zelenskyy and President Trump on February 28th, 2025, put negotiations at a standstill. Ukraine ultimately came back to the table after the United States stopped sharing military intelligence and military aid. The more difficult part of the peace deal has proven to be getting Russia to the table. Russia has already issued several red lines to the proposal, suggesting any long-term resolution may take longer to negotiate.

The Bottom Line:
A long-term agreement to peace in the region will likely take time, effort, and cooperation from all sides. This includes the United States and other European countries. From an investment perspective, investors still require a larger premium for taking on the added risk of investing in the region or assets tied to the region, including wheat.

Your Economic and Market Detailed Recaps

  • Small business owners growing more uncertain.
  • CPI inflation increases less than expected; still elevated.
  • Consumer sentiment plummets on increased uncertainty.
  • Global equities fall as U.S. recession fears surge.
  • Treasury yields whipsawed by economic data.
  • Commodities higher led by safe-haven Gold.

Weekly Economic Recap — Consumer Sentiment Plummets on Increased
Uncertainty

Small business optimism fell to a four-month low in February (100.7). The uncertainty index surged as owners cited the need for more clarity on tariffs. Owners indicated they raised prices by the most since April 2021.

Job openings increased in January to 7.74 million (from 7.51 million). The increase in job openings was led by the retail and finance industries. Layoffs fell to a seven-month low (1.64 million) while the quits rate increased to its highest level since August 2024 (2.1%).

Inflation as tracked by the Consumer Price Index increased less than expected in February on an annualized basis (2.8% vs. 2.9%). Shelter costs accounted for nearly half of the monthly increase at the headline level, but the annualized increase (4.2%) was the smallest since December 2021. Food prices increased at the fastest pace since January 2024 (2.4%) led by a continued surge in egg prices. CPI core, which excludes volatile food and energy prices, increased at the slowest annualized pace (3.1%) since April 2021.

Producer prices were lower on an annualized basis in February from the prior month (3.2% vs. 3.7%). A drop in services prices, led by a decrease in margins for machinery and vehicle wholesaling, offsett an increase in goods prices. Food prices accounted for nearly 70% of the headline advance on a monthly basis. Core prices decreased for the first time since July.

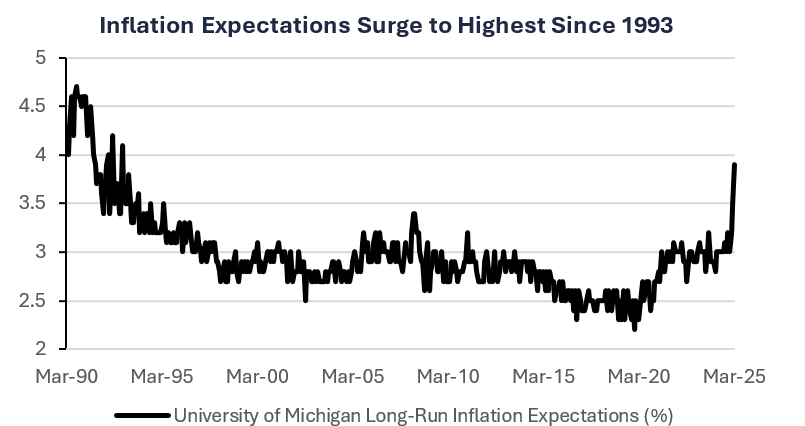
Consumer sentiment as tracked by the University of Michigan fell for the third consecutive month. Expectations for future conditions deteriorated as consumers cited a high level of uncertainty around policy and economic factors. Long-run inflation expectations increased to 3.9% from 3.5%, marking the largest monthly increase since 1993.

Weekly Market Recap — Global Equities Lower on U.S. Recession Fears and Trade Uncertainty

Equities: The MSCI AC World Index was lower for the fourth straight week. Recession fears surged in the U.S. last week, causing all major averages to end the week lower and are now lower for the year. Uncertainty around trade policy also contributed to negative U.S. equity returns. German equities led gains in Europe on increased defense spending initiatives, while shares in China rallied on hopes of stimulus plans increasing consumption.

Fixed Income: The Bloomberg Aggregate Index was lower for the second straight week. Treasury yields were flat to slighly higher across the curve last week, whipsawed by lighter-than-expected inflation data and inflation expectations increasing to their highest since 1993. Floating rate instruments were slightly higher while other areas underperformed.

Commodities/FX: The Bloomberg Commodity Index was higher for the second straight week. Crude oil prices were slighly higher as investors grew pessimistic about an end to the Russia/Ukraine war. Gold prices ended the week above the $3,000/oz. level for the first time ever as investors flocked to the safe-haven amid trade policy uncertainty.


Inflation Expectations Surge to Highest Since 1993 chart from Verdence


Data is as of February 2025.
Source: FactSet Research Systems, Verdence Capital Advisors

Disclaimer: © Verdence Capital Advisors, LLC

Reproduction without permission is not permitted. The indexes presented are unmanaged portfolios of specified securities and do not reflect any initial or ongoing expenses nor can it be invested in directly. An investment’s portfolio may differ significantly from the securities in the index.  This material was prepared by Verdence Capital Advisors, LLC (“VCA” or “we”, “our”, “us”). VCA believes the information and data in this document were obtained from sources considered reliable and correct and cannot guarantee either their accuracy or completeness. VCA has not independently verified third-party sourced information and data. Any projections, outlooks or assumptions should not be construed to be indicative of the actual events which will occur. These projections, market outlooks or estimates are subject to change without notice. This material is being provided for informational purposes only and is not intended to provide, and should not be relied upon for, investment, accounting, legal, or tax advice. Past performance is not a guarantee of future results. Different types of investments involve varying degrees of risk, and there can be no assurance that the future performance of any specific investment, investment strategy, or product or any non-investment related content, made reference to directly or indirectly in these materials will be profitable, equal any corresponding indicated historical performance level(s), be suitable for your portfolio or individual situation, or prove successful. You should not assume that any discussion or information contained in this report serves as the receipt of, or as a substitute for, personalized investment advice from VCA. Alternative investments are designed only for sophisticated investors who are able to bear the risk of the loss of their entire investment. Investing in alternative investments should be viewed as illiquid and generally not readily marketable or transferable. Investors should be prepared to bear the financial risks of investing in an alternative investment for an indefinite period of time. Due to various factors, including changing market conditions and/or applicable laws, the content may no longer be reflective of current opinions or positions. All indexes are unmanaged, and you cannot invest directly in an index. Index returns do not include fees or expenses. Sector Watch Use of this website is intended for U.S. residents only. Any recommendation, opinion or advice regarding securities or markets contained in such material does not reflect the views of Verdence Capital, and Verdence Capital does not verify any information included in such material. Verdence Capital assumes no responsibility for any fact, recommendation, opinion, or advice contained in any such research material and expressly disclaims any responsibility for any decisions or for the suitability of any security or transaction based on it. Any decisions you may make to buy, sell, or hold a security based on this research will be entirely your own and not in any way deemed to be endorsed or influenced by or attributed to Verdence Capital. It is understood that, without exception, any order based on such research that is placed for execution is and will be treated as an UNRECOMMENDED AND UNSOLICITED ORDER. Further, Verdence Capital assumes no responsibility for the accuracy, completeness, or timeliness of any such research or for updating such research, which is subject to change without notice at any time. Verdence Capital does not provide tax, or legal advice. Under no circumstance is the information contained within this research to be used or considered as an offer to sell or a solicitation of an offer to buy any particular investment/security. Fixed income securities are subject to increased loss of principal during periods of rising interest rates. Fixed income investments are subject to various other risks including changes in credit quality, market valuations, liquidity, prepayments, early redemption, corporate events, tax ramifications and other factors. Lower rated securities are subject to greater credit risk, default risk, and liquidity risk. Commodity‐related products, including futures, carry a high level of risk and are not suitable for all investors. Commodity‐related products may be extremely volatile, illiquid and can be significantly affected by underlying commodity prices, world events, import controls, worldwide competition, government regulations, and economic conditions, regardless of the length of time shares are held. Data is provided for information purposes only and is not intended for trading purposes. Verdence Capital shall not be liable for any errors or delay in the content, or for any action taken in reliance on any content. Weekly Insights/Qtrly & Annual Outlook The indexes presented are unmanaged portfolios of specified securities and do not reflect any initial or ongoing expenses nor can it be invested in directly. An investment’s portfolio may differ significantly from the securities in the index. Semi-Annual Chart Pack Where shown, performance information presented is that which has been calculated and presented by an unaffiliated third-party manager. We have no insight into the performance of the advisor/product/account or fund shown and do not attempt to determine whether the performance presented is accurate. Therefore, the performance could be incorrect, overstated or not reflective of actual trading of client funds. There is the potential that the performance shown is a back test and not the result of real investment advice and trading. As such, it could not be relied upon as indicative of future returns of a particular strategy. Where performance shown is that of a pooled account, limited partnership, or private equity fund, you should be aware that there is a significant lack of transparency into the operations and investment process and investment vehicles invested in. As a result, pricing and valuation of the underlying holdings which produced the stated performance could be incorrect, stale, or overstated and therefore the performance figures presented cannot be relied upon. Before investing, we encourage you to request additional information, particularly performance information, of any product that you are considering for your client. You should read, as applicable, the Prospectus, SAI, Composite Disclosure and/or performance disclosure associated with any product that you are considering for investment for your or your client’s. Products shown may have minimum account sizes or minimum investments which may preclude retail and non-high net worth investors from being able to invest in these products. You should be aware that certain LPs may be closed to new investors and therefore your clients may be prevented from investing in these products. Portfolio Implementation and Rationales The SMA Asset Allocation Models do not represent a personalized recommendation of a particular investment strategy to you or your clients. You should not buy or sell an investment without first considering whether it is appropriate for your client’s portfolio. Additionally, you should review and consider any recent market news. All expressions of opinion are subject to change without notice in reaction to shifting market conditions. Data contained herein from third-party providers is obtained from what are considered reliable sources. However, its accuracy, completeness or reliability cannot be guaranteed. Supporting documentation for any claims or statistical information is available upon request. Examples provided are for illustrative purposes only and not intended to be reflective of results you can expect to achieve. Diversification and asset allocation do not ensure a profit and do not protect against losses in declining markets. Any forecasts contained herein are for illustrative purposes only, may be based upon proprietary research and are developed through analysis of historical public data. Investments in growth stocks may experience price volatility due to their sensitivity to market fluctuations and dependence on future earnings expectations. Sector allocation references to market capitalization (“smid cap” or “micro caps” etc.) may be subject to special risks given their characteristic narrow markets, limited financial resources, and less liquid stocks, all of which may cause price volatility. International/global investing can involve special risks, such as political changes and currency fluctuations. These risks are heightened in emerging markets. A significant percentage of the underlying investments in aggressive asset allocation portfolio investments have a higher-than-average risk exposure. You should consider your risk tolerance of each of your clients carefully before choosing such a strategy. An investment with multiple underlying investments (which may include asset-allocation or custom blended investments) may be subject to the expenses of those underlying investments in addition to those of the investment itself. Investments may reside in the specialty category due to 1) allowable investment flexibility that precludes classification in standard asset categories and/or 2) investment concentration in a limited group of securities or industry sectors. Investments in this category may be more volatile than less flexible and/or less concentrated investments and may be appropriate as only a minor component in an investor’s overall portfolio. Investment Managers You and your clients should carefully consider investment objectives, risks, charges, and expenses of Funds discussed. This and other important information are contained in the respective Fund prospectuses and summary prospectuses, which should be read carefully before investing. Investment portfolio statistics change over time. Current performance may be lower or higher than return data quoted herein. The investment return and the principal value of an investment will fluctuate; so, an investor’s shares/units, when redeemed, may be worth more or less than their original cost. Verdence relies heavily on unaudited third-party data. Data sources include public data, such as mutual fund data, and non-public data, such as information provided by other investment advisors and managers of limited partnership pooled accounts. Data and/or statistics included on this Portal, including references to performance, opinions, ratings, rankings, manager statistics and demographic information, product, or strategy descriptions, either quantitative or qualitative, are based upon information reasonably available to us as of the applicable date(s) then-published. Information has been obtained from sources that we believe to be reliable, but these sources cannot be guaranteed as to their accuracy or completeness. All data and information produced by a third party has the potential to be incorrect, incomplete, or otherwise misleading. No implication shall be created that the information contained on the Site is correct, including as of any time subsequent to the publish date, and Verdence does not undertake an obligation to update such information at any time after such date. Verdence makes not warranty or representation of the veracity of the data and information and its use of the information should not be implied as an endorsement of any material or statements made. Data, particularly non-public data, is subject to error and where the information is not audited, the potential for error is greater. Where shown, performance information presented is that which has been calculated and presented by an unaffiliated third-party manager. We have no insight into the performance of the advisor/product/account or fund shown and do not attempt to determine whether the performance presented is accurate. Therefore, the performance could be incorrect, overstated or not reflective of actual trading of client funds. There is the potential that the performance shown is a back test and not the result of real investment advice and trading. As such, it could not be relied upon as indicative of future returns of a particular strategy. Where performance shown is that of a pooled account, limited partnership, or private equity fund, you should be aware that there is a significant lack of transparency into the operations and investment process and investment vehicles invested in. As a result, pricing and valuation of the underlying holdings which produced the stated performance could be incorrect, stale, or overstated and therefore the performance figures presented cannot be relied upon. Before investing, we encourage you to request additional information, particularly performance information, of any product that you are considering for your client. You should read, as applicable, the Prospectus, SAI, Composite Disclosure and/or performance disclosure associated with any product that you are considering for investment for your or your client’s. Certain products shown may have account minimums or minimum investment sizes that are unattainable for your clients and therefore they may not be eligible to invest in these products. Reference to registration with the Securities and Exchange Commission (“SEC”) does not imply that the SEC has endorsed or approved the qualifications of Verdence or its respective representatives to provide any advisory services described on the Site.

Read more