WEEKLY INSIGHTS

August 12, 2024
Download PDF

Key Takeaways:

  • Light data week contributed to turnaround.
  • Recession is still a threat.
  • Bond auctions weak; can threaten growth and fuel higher rates.
  • Negative seasonality just starting.
  • Expect additional downside in the coming months.

Theme of the Week — Too Soon to Say the Bottom Is In?

We welcome last week’s market turnaround however, we do not believe that volatility is behind us and we warn investors of additional downside in the coming months. While some of the sell off that occurred in the beginning of August can be attributed to technicals, algorithmic trading and the unwinding of the Yen carry trade, there are other reasons for the sell off that have not changed. In this commentary, we will identify the factors that we see as additional risk to equities. We will also reiterate that we will look for buying opportunities on the downside but only if prices are discounting risk.

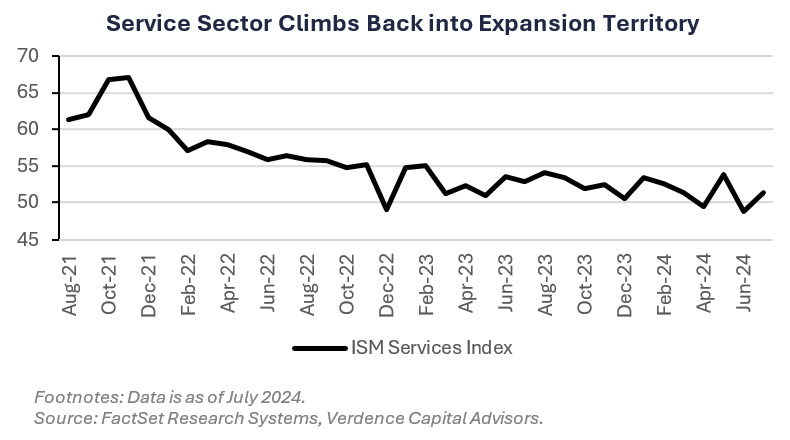
  • A light data week for investors: Last week investors did not have much data to absorb. The only major piece of data was the ISM Services Index that came in modestly better than expected. While markets cheered the reading, they also neglected to see the prices paid component jumped which is an inflation concern. While weekly jobless claims did not offer any surprises, continuing claims rose again and are at the highest level since 2021. This week markets will have much more data to digest, including several inflation reports and data on the consumer.
  • Recession is still on the table: The economy has not miraculously turned around to support the rebound last week. In fact, the inflation data from the service report should have investors more concerned about the Fed’s flexibility to ease policy. Realistically, the consumer is squeezed and the last domino to fall is the labor market, and that is unraveling. Weekly hours are at the lowest level since April 2020, those working part-time for economic reasons are at a three-year high and temporary workers have been cut for 26 out of the past 28 months. These are leading indicators for higher unemployment.
  • Bond auctions an issue: Last week we saw sloppy 10 and 30-year Treasury auctions which sent yields higher. Demand at the 10-year auction was the lowest since December 2022. In the 30-year, primary dealers were stuck buying the most supply since November 2023. Yields will continue to rise if we cannot find buyers for the massive amount of fiscal debt that our country is issuing. This will push lending rates higher for consumers.
  • We are in the beginning of negative seasonality: Historically, two of the worst months of the year are August and September. In addition, going back to 1928 there are more pullbacks of 10% or more in the month of October than any other month in the year.
  • Capitulation factors not triggered: We look at several indicators (e.g. put/call ratio, VIX, spreads) to decipher if a downturn has reached a level of being washed out. On the final day of the recent weakness (i.e. August 5) not one of capitulation indicators was triggered.
  • Earnings will need to come down: With the likelihood of a recession increasing, current estimates for double-digit earnings growth this year and next are unlikely to be achieved.

The Bottom Line

Nothing has changed since the market sell-off in early August. In fact, we see the downside risks for the economy growing, which does not justify equities at current levels. We expect additional downside in the coming months.

Footnotes: Data is as of August 9, 2024.

Source: Bloomberg Finance LP, Verdence Capital Advisors.

Your Economic and Market Detailed Recaps

Key Takeaways:

  • Services sector expands by most in four years.
  • Consumers slow the pace of spending on credit, but balances still rise.
  • Initial claims for unemployment fall by most in a year.
  • Global equities post impressive reversal after early week‘s losses.
  • Bond yields rise as investors assess the Fed’s path forward.
  • Crude oil prices rise on fears of global supply shortage.

Weekly Economic Recap — Service Sector Climbs Back into Expansion Territory

The U.S. services sector expanded in July by the most in four years according to the ISM Services Index. The employment index increased for the first time since the start of the year and at the fastest pace since September. New orders increased back into expansion territory (a reading above 50).

Consumer borrowing increased by less than expected in June driven by smaller spending on credit-cards. Total credit outstanding increased $8.9 billion, less than consensus estimates for an increase of $10 billion. Revolving credit (i.e., credit cards) declined by the most since 2021.

The US trade deficit narrowed for the first time in three months as the value of exports for goods and services increased by the most since the start of the year. The value of exports increased 1.5%, outpacing the rise in the price of imports of 0.6%. The trade deficit with China increased to a four-month high ($22.3 billion).

Initial claims for unemployment benefits fell last week by the most in roughly a year (17k), falling to 233k. Continuing claims, which run a week behind the headline number, increased to 1.88 million, in line with consensus estimates.

Consumer credit card balances, according to a report by TransUnion, have ballooned to a record $1.14 trillion. The average borrower owes $6,329, an increase of 4.8% YoY. Credit card delinquency rates are higher as well according to the report, as roughly 9% of balances transitioned into delinquency over the past year.

Weekly Market Recap — Global Equities Post Impressive Comeback, but Still Lower for the Week

Equities: The MSCI AC World Index ended the week relatively unchanged as global equity markets staged an impressive turnaround after steep losses ushered in the week. In the U.S., all major averages were lower but clawed back much of their early week losses. In fact, large-cap growth, as tracked by the Russell 1000 Growth Index, ended the week higher for the first time in five weeks.

Fixed Income: The Bloomberg Barclays Aggregate Index was lower for the first time in three weeks. Bond yields moved higher (prices were lower) as investors continued to digest the state of the economy and the Fed’s path forward. High yield corporate bonds and U.S. floating rate instruments were the only areas of fixed income higher for the week.

Commodities/FX: The Bloomberg Commodity Index was higher for the first time in five weeks. Crude oil prices were higher for the first time in five weeks as well as investors weigh the likelihood of a wider conflict in the Middle East that could disrupt global supply. Gold prices were marginally higher for the second straight week.


Data is as of August 9, 2024.
Source: Bloomberg Finance LP, Verdence Capital Advisors.

Disclaimer: © 2024 Authored by Megan Horneman, Chief Investment Officer, Verdence Capital Advisors, LLC

Reproduction without permission is not permitted. The indexes presented are unmanaged portfolios of specified securities and do not reflect any initial or ongoing expenses nor can it be invested in directly. An investment’s portfolio may differ significantly from the securities in the index.  This material was prepared by Verdence Capital Advisors, LLC (“VCA” or “we”, “our”, “us”). VCA believes the information and data in this document were obtained from sources considered reliable and correct and cannot guarantee either their accuracy or completeness. VCA has not independently verified third-party sourced information and data. Any projections, outlooks or assumptions should not be construed to be indicative of the actual events which will occur. These projections, market outlooks or estimates are subject to change without notice. This material is being provided for informational purposes only and is not intended to provide, and should not be relied upon for, investment, accounting, legal, or tax advice. Past performance is not a guarantee of future results. Different types of investments involve varying degrees of risk, and there can be no assurance that the future performance of any specific investment, investment strategy, or product or any non-investment related content, made reference to directly or indirectly in these materials will be profitable, equal any corresponding indicated historical performance level(s), be suitable for your portfolio or individual situation, or prove successful. You should not assume that any discussion or information contained in this report serves as the receipt of, or as a substitute for, personalized investment advice from VCA. Alternative investments are designed only for sophisticated investors who are able to bear the risk of the loss of their entire investment. Investing in alternative investments should be viewed as illiquid and generally not readily marketable or transferable. Investors should be prepared to bear the financial risks of investing in an alternative investment for an indefinite period of time. Due to various factors, including changing market conditions and/or applicable laws, the content may no longer be reflective of current opinions or positions. All indexes are unmanaged, and you cannot invest directly in an index. Index returns do not include fees or expenses. Sector Watch Use of this website is intended for U.S. residents only. Any recommendation, opinion or advice regarding securities or markets contained in such material does not reflect the views of Verdence Capital, and Verdence Capital does not verify any information included in such material. Verdence Capital assumes no responsibility for any fact, recommendation, opinion, or advice contained in any such research material and expressly disclaims any responsibility for any decisions or for the suitability of any security or transaction based on it. Any decisions you may make to buy, sell, or hold a security based on this research will be entirely your own and not in any way deemed to be endorsed or influenced by or attributed to Verdence Capital. It is understood that, without exception, any order based on such research that is placed for execution is and will be treated as an UNRECOMMENDED AND UNSOLICITED ORDER. Further, Verdence Capital assumes no responsibility for the accuracy, completeness, or timeliness of any such research or for updating such research, which is subject to change without notice at any time. Verdence Capital does not provide tax, or legal advice. Under no circumstance is the information contained within this research to be used or considered as an offer to sell or a solicitation of an offer to buy any particular investment/security. Fixed income securities are subject to increased loss of principal during periods of rising interest rates. Fixed income investments are subject to various other risks including changes in credit quality, market valuations, liquidity, prepayments, early redemption, corporate events, tax ramifications and other factors. Lower rated securities are subject to greater credit risk, default risk, and liquidity risk. Commodity‐related products, including futures, carry a high level of risk and are not suitable for all investors. Commodity‐related products may be extremely volatile, illiquid and can be significantly affected by underlying commodity prices, world events, import controls, worldwide competition, government regulations, and economic conditions, regardless of the length of time shares are held. Data is provided for information purposes only and is not intended for trading purposes. Verdence Capital shall not be liable for any errors or delay in the content, or for any action taken in reliance on any content. Weekly Insights/Qtrly & Annual Outlook The indexes presented are unmanaged portfolios of specified securities and do not reflect any initial or ongoing expenses nor can it be invested in directly. An investment’s portfolio may differ significantly from the securities in the index. Semi-Annual Chart Pack Where shown, performance information presented is that which has been calculated and presented by an unaffiliated third-party manager. We have no insight into the performance of the advisor/product/account or fund shown and do not attempt to determine whether the performance presented is accurate. Therefore, the performance could be incorrect, overstated or not reflective of actual trading of client funds. There is the potential that the performance shown is a back test and not the result of real investment advice and trading. As such, it could not be relied upon as indicative of future returns of a particular strategy. Where performance shown is that of a pooled account, limited partnership, or private equity fund, you should be aware that there is a significant lack of transparency into the operations and investment process and investment vehicles invested in. As a result, pricing and valuation of the underlying holdings which produced the stated performance could be incorrect, stale, or overstated and therefore the performance figures presented cannot be relied upon. Before investing, we encourage you to request additional information, particularly performance information, of any product that you are considering for your client. You should read, as applicable, the Prospectus, SAI, Composite Disclosure and/or performance disclosure associated with any product that you are considering for investment for your or your client’s. Products shown may have minimum account sizes or minimum investments which may preclude retail and non-high net worth investors from being able to invest in these products. You should be aware that certain LPs may be closed to new investors and therefore your clients may be prevented from investing in these products. Portfolio Implementation and Rationales The SMA Asset Allocation Models do not represent a personalized recommendation of a particular investment strategy to you or your clients. You should not buy or sell an investment without first considering whether it is appropriate for your client’s portfolio. Additionally, you should review and consider any recent market news. All expressions of opinion are subject to change without notice in reaction to shifting market conditions. Data contained herein from third-party providers is obtained from what are considered reliable sources. However, its accuracy, completeness or reliability cannot be guaranteed. Supporting documentation for any claims or statistical information is available upon request. Examples provided are for illustrative purposes only and not intended to be reflective of results you can expect to achieve. Diversification and asset allocation do not ensure a profit and do not protect against losses in declining markets. Any forecasts contained herein are for illustrative purposes only, may be based upon proprietary research and are developed through analysis of historical public data. Investments in growth stocks may experience price volatility due to their sensitivity to market fluctuations and dependence on future earnings expectations. Sector allocation references to market capitalization (“smid cap” or “micro caps” etc.) may be subject to special risks given their characteristic narrow markets, limited financial resources, and less liquid stocks, all of which may cause price volatility. International/global investing can involve special risks, such as political changes and currency fluctuations. These risks are heightened in emerging markets. A significant percentage of the underlying investments in aggressive asset allocation portfolio investments have a higher-than-average risk exposure. You should consider your risk tolerance of each of your clients carefully before choosing such a strategy. An investment with multiple underlying investments (which may include asset-allocation or custom blended investments) may be subject to the expenses of those underlying investments in addition to those of the investment itself. Investments may reside in the specialty category due to 1) allowable investment flexibility that precludes classification in standard asset categories and/or 2) investment concentration in a limited group of securities or industry sectors. Investments in this category may be more volatile than less flexible and/or less concentrated investments and may be appropriate as only a minor component in an investor’s overall portfolio. Investment Managers You and your clients should carefully consider investment objectives, risks, charges, and expenses of Funds discussed. This and other important information are contained in the respective Fund prospectuses and summary prospectuses, which should be read carefully before investing. Investment portfolio statistics change over time. Current performance may be lower or higher than return data quoted herein. The investment return and the principal value of an investment will fluctuate; so, an investor’s shares/units, when redeemed, may be worth more or less than their original cost. Verdence relies heavily on unaudited third-party data. Data sources include public data, such as mutual fund data, and non-public data, such as information provided by other investment advisors and managers of limited partnership pooled accounts. Data and/or statistics included on this Portal, including references to performance, opinions, ratings, rankings, manager statistics and demographic information, product, or strategy descriptions, either quantitative or qualitative, are based upon information reasonably available to us as of the applicable date(s) then-published. Information has been obtained from sources that we believe to be reliable, but these sources cannot be guaranteed as to their accuracy or completeness. All data and information produced by a third party has the potential to be incorrect, incomplete, or otherwise misleading. No implication shall be created that the information contained on the Site is correct, including as of any time subsequent to the publish date, and Verdence does not undertake an obligation to update such information at any time after such date. Verdence makes not warranty or representation of the veracity of the data and information and its use of the information should not be implied as an endorsement of any material or statements made. Data, particularly non-public data, is subject to error and where the information is not audited, the potential for error is greater. Where shown, performance information presented is that which has been calculated and presented by an unaffiliated third-party manager. We have no insight into the performance of the advisor/product/account or fund shown and do not attempt to determine whether the performance presented is accurate. Therefore, the performance could be incorrect, overstated or not reflective of actual trading of client funds. There is the potential that the performance shown is a back test and not the result of real investment advice and trading. As such, it could not be relied upon as indicative of future returns of a particular strategy. Where performance shown is that of a pooled account, limited partnership, or private equity fund, you should be aware that there is a significant lack of transparency into the operations and investment process and investment vehicles invested in. As a result, pricing and valuation of the underlying holdings which produced the stated performance could be incorrect, stale, or overstated and therefore the performance figures presented cannot be relied upon. Before investing, we encourage you to request additional information, particularly performance information, of any product that you are considering for your client. You should read, as applicable, the Prospectus, SAI, Composite Disclosure and/or performance disclosure associated with any product that you are considering for investment for your or your client’s. Certain products shown may have account minimums or minimum investment sizes that are unattainable for your clients and therefore they may not be eligible to invest in these products. Reference to registration with the Securities and Exchange Commission (“SEC”) does not imply that the SEC has endorsed or approved the qualifications of Verdence or its respective representatives to provide any advisory services described on the Site.

Read more