WEEKLY INSIGHTS

September 23, 2024
Download PDF

Key Takeaways:

  • Fed delivers on the 50-bps rate cut.
  • Should offer limited relief to credit card holders in the near term.
  • Bringing life back to the housing market but watch Treasury yields.
  • Interest costs on federal debt still a problem for the deficit.
  • Not as optimistic Fed can deliver on markets expectations.

The Fed Cut Rates… So Now What?

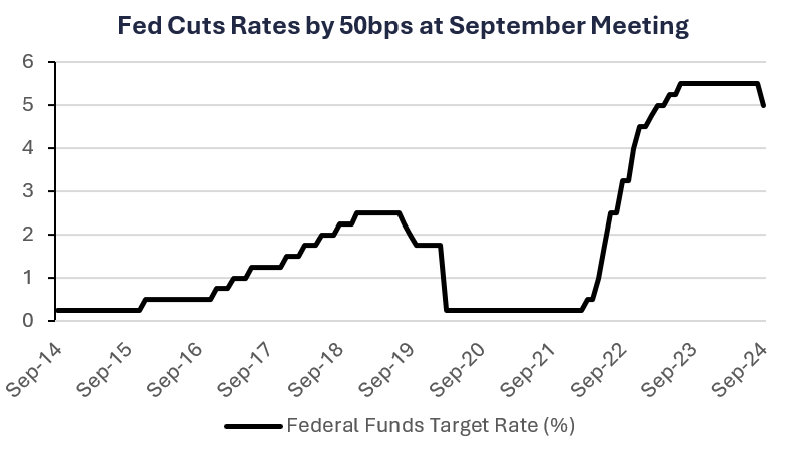
Last week, the Federal Reserve cut interest rates by 50bps to a range of 4.75% – 5.00%. This was the first interest rate cut since the onset of the Covid pandemic, and the first time the Fed has cut by 50bps since 2008. After the interest rate cut, some may be wondering what this means and how the cuts will filter through the economy. In this weekly, we aim to provide an overview of how the interest rate cuts may impact the economy and consumers.

  • Credit card rates may move modestly lower: Credit card debt continues to surge and sits at a record high (at $1.4 trillion) as consumers have struggled to keep up with the years of high inflation. According to TransUnion, the average credit card balance is over $6K and the average credit card rate is over 20%. While consumers will welcome any relief in the high level of interest on credit cards, it is important to note that variable-rate credit cards are priced off the prime rate. While that rate came down last week with the Fed funds rate, at 8%, that is still a high level of interest. Therefore, consumers should not expect a massive change in their credit card rates.
  • Bringing optimism to the depressed housing market: Last week we saw the first increase in homebuilder sentiment in six months as the market had already priced in the Fed’s move. The mortgage rate has been declining even before the Fed cut rates as Treasury yields have fallen. According to the Mortgage Bankers Association, the mortgage rate has fallen from its high reached in October of last year (7.9%) to 6.15%. To understand the impact that can have on mortgage payments let’s consider a $415K mortgage. At 7.9% that monthly mortgage payment (interest and principal only) would have been ~$3,020 a month. At 6.15%, that mortgage payment has fallen to ~$2,530, a difference of almost $500 a month. We are hopeful this can help the ailing housing market. However, we also need to monitor Treasury yields because mortgage rates are based off longer term Treasury yields and not the Fed Funds rate. After the Fed’s rate cut, long term Treasury yields rose as the yield curve is normalizing and bond investors remain concerned about inflation.
  • Interest costs on federal debt: The U.S. government has spent more than $1 trillion this year on net interest payments, greater than the $892 billion projected by the Congressional Budget Office in June.1 According to CBO’s most recent long-term projections, interest payments are expected to total ~$78 trillion over the next 30 years.2 These projections already factor in the expectation for lower rates. Therefore, for the deficit to improve we need a combination of low rates and controlled spending.

The Bottom Line:The cut in the Fed funds rate has been celebrated by equity markets. However, we remain skeptical that the Fed can cut rates as low as the futures market is expecting and even the Fed’s projections. With over 150 bps of rate cuts priced in over the next year, this is highly dependant on the outlook for inflation. We realize inflation is moving in the right direction but the Fed is walking a fine line with the money supply still near a record high and pockets of inflation growing much more than real earnings.

Your Economic and Market Detailed Recaps

Key Takeaways:

  • Homebuilder confidence increases.
  • Fed cuts rates by 50bps, remains data dependent.
  • Leading Indicators Index falls again.
  • Global equities rally after Fed rate cut.
  • Bond yields move higher despite Fed rate cut.
  • Commodities higher driven by energy prices.

Weekly Economic Recap — Fed Cuts Rates by 50bps, but Remains Data Dependent

Retail sales unexpectedly increased in August and the July increase was revised slightly higher (to 1.1% vs. 1.0%). The increase was driven by online purchases which offset a pullback in autos spending. The core group, which excludes volatile components and are related to the consumer spending component of GDP, increased for the fourth straight month.

Confidence among home builders increased in September for the first time in six months according to the NAHB Housing Market Index. The outlook index increased 4 points, the most since January. Additionally, measures of prospective-buyer traffic and present sales rose off their 2024 lows.

The Federal Reserve cut interest rates by 50bps (4.75% – 5.00%) in an 11-1 vote at their meeting last week. It is the first cut of that size since 2008. The central bank also released updated projections, which indicated members see the equivalent of ~50bps more of cuts by the end of the year. The statement stated, “the Committee has gained greater confidence that inflation is moving toward 2%.” During his press conference, Fed Chairman Powell stated, “I do not think anyone should look at this and say, ‘this is the new pace,” reaffirming the Committee will remain data dependent.

Completions of housing in the US increased in August. Completions of multifamily housing units increased by 759k in August, the most since July 1974. Regionally, this increase was concentrated in the South.

The Leading Economic Indicators Index declined for the 30th month out of the past 32 in August. Weakness in new orders, which recorded its lowest value since 2023, and a negative interest rate spread were the largest contributors to the fall in the index.

Weekly Market Recap — Global Equities Rally After Fed Cuts Rates by 50bps

Equities: The MSCI AC World Index was higher for the fourth consecutive week as equity markets rallied after the Federal Reserve cut interest rates by 50bps. All major averages in the U.S. were higher for the week. Small-caps, which tend to be more sensitive to changes in interest rates, outperformed after the Fed cut rates. The S&P 500 and Nasdaq Composite were both higher for the second straight week.

Fixed Income: The Bloomberg Barclays Aggregate Index was lower for the first time in three weeks. U.S. Treasury yields finished the week slightly higher despite the Fed cutting interest rates. High yield corporate bonds and EM debt (USD) were the best performing areas of fixed income while Treasuries suffered.

Commodities/FX: The Bloomberg Commodity Index was higher for the second straight week. Crude oil was higher for the second straight week as supply in the U.S fell as major refineries in the Gulf of Mexico remain offline after Hurricane Francine. Gold prices finished the week above the $2,600/oz. level on rising tensions in the Middle East.


Fed 50 bps rate cut, credit card relief, housing market, debt, markets insights


Data is as of Setpember 2024.
Source: FactSet Research Systems, Verdence Capital Advisors

Disclaimer: © 2024 Authored by Megan Horneman, Chief Investment Officer, Verdence Capital Advisors, LLC

Reproduction without permission is not permitted. The indexes presented are unmanaged portfolios of specified securities and do not reflect any initial or ongoing expenses nor can it be invested in directly. An investment’s portfolio may differ significantly from the securities in the index.  This material was prepared by Verdence Capital Advisors, LLC (“VCA” or “we”, “our”, “us”). VCA believes the information and data in this document were obtained from sources considered reliable and correct and cannot guarantee either their accuracy or completeness. VCA has not independently verified third-party sourced information and data. Any projections, outlooks or assumptions should not be construed to be indicative of the actual events which will occur. These projections, market outlooks or estimates are subject to change without notice. This material is being provided for informational purposes only and is not intended to provide, and should not be relied upon for, investment, accounting, legal, or tax advice. Past performance is not a guarantee of future results. Different types of investments involve varying degrees of risk, and there can be no assurance that the future performance of any specific investment, investment strategy, or product or any non-investment related content, made reference to directly or indirectly in these materials will be profitable, equal any corresponding indicated historical performance level(s), be suitable for your portfolio or individual situation, or prove successful. You should not assume that any discussion or information contained in this report serves as the receipt of, or as a substitute for, personalized investment advice from VCA. Alternative investments are designed only for sophisticated investors who are able to bear the risk of the loss of their entire investment. Investing in alternative investments should be viewed as illiquid and generally not readily marketable or transferable. Investors should be prepared to bear the financial risks of investing in an alternative investment for an indefinite period of time. Due to various factors, including changing market conditions and/or applicable laws, the content may no longer be reflective of current opinions or positions. All indexes are unmanaged, and you cannot invest directly in an index. Index returns do not include fees or expenses. Sector Watch Use of this website is intended for U.S. residents only. Any recommendation, opinion or advice regarding securities or markets contained in such material does not reflect the views of Verdence Capital, and Verdence Capital does not verify any information included in such material. Verdence Capital assumes no responsibility for any fact, recommendation, opinion, or advice contained in any such research material and expressly disclaims any responsibility for any decisions or for the suitability of any security or transaction based on it. Any decisions you may make to buy, sell, or hold a security based on this research will be entirely your own and not in any way deemed to be endorsed or influenced by or attributed to Verdence Capital. It is understood that, without exception, any order based on such research that is placed for execution is and will be treated as an UNRECOMMENDED AND UNSOLICITED ORDER. Further, Verdence Capital assumes no responsibility for the accuracy, completeness, or timeliness of any such research or for updating such research, which is subject to change without notice at any time. Verdence Capital does not provide tax, or legal advice. Under no circumstance is the information contained within this research to be used or considered as an offer to sell or a solicitation of an offer to buy any particular investment/security. Fixed income securities are subject to increased loss of principal during periods of rising interest rates. Fixed income investments are subject to various other risks including changes in credit quality, market valuations, liquidity, prepayments, early redemption, corporate events, tax ramifications and other factors. Lower rated securities are subject to greater credit risk, default risk, and liquidity risk. Commodity‐related products, including futures, carry a high level of risk and are not suitable for all investors. Commodity‐related products may be extremely volatile, illiquid and can be significantly affected by underlying commodity prices, world events, import controls, worldwide competition, government regulations, and economic conditions, regardless of the length of time shares are held. Data is provided for information purposes only and is not intended for trading purposes. Verdence Capital shall not be liable for any errors or delay in the content, or for any action taken in reliance on any content. Weekly Insights/Qtrly & Annual Outlook The indexes presented are unmanaged portfolios of specified securities and do not reflect any initial or ongoing expenses nor can it be invested in directly. An investment’s portfolio may differ significantly from the securities in the index. Semi-Annual Chart Pack Where shown, performance information presented is that which has been calculated and presented by an unaffiliated third-party manager. We have no insight into the performance of the advisor/product/account or fund shown and do not attempt to determine whether the performance presented is accurate. Therefore, the performance could be incorrect, overstated or not reflective of actual trading of client funds. There is the potential that the performance shown is a back test and not the result of real investment advice and trading. As such, it could not be relied upon as indicative of future returns of a particular strategy. Where performance shown is that of a pooled account, limited partnership, or private equity fund, you should be aware that there is a significant lack of transparency into the operations and investment process and investment vehicles invested in. As a result, pricing and valuation of the underlying holdings which produced the stated performance could be incorrect, stale, or overstated and therefore the performance figures presented cannot be relied upon. Before investing, we encourage you to request additional information, particularly performance information, of any product that you are considering for your client. You should read, as applicable, the Prospectus, SAI, Composite Disclosure and/or performance disclosure associated with any product that you are considering for investment for your or your client’s. Products shown may have minimum account sizes or minimum investments which may preclude retail and non-high net worth investors from being able to invest in these products. You should be aware that certain LPs may be closed to new investors and therefore your clients may be prevented from investing in these products. Portfolio Implementation and Rationales The SMA Asset Allocation Models do not represent a personalized recommendation of a particular investment strategy to you or your clients. You should not buy or sell an investment without first considering whether it is appropriate for your client’s portfolio. Additionally, you should review and consider any recent market news. All expressions of opinion are subject to change without notice in reaction to shifting market conditions. Data contained herein from third-party providers is obtained from what are considered reliable sources. However, its accuracy, completeness or reliability cannot be guaranteed. Supporting documentation for any claims or statistical information is available upon request. Examples provided are for illustrative purposes only and not intended to be reflective of results you can expect to achieve. Diversification and asset allocation do not ensure a profit and do not protect against losses in declining markets. Any forecasts contained herein are for illustrative purposes only, may be based upon proprietary research and are developed through analysis of historical public data. Investments in growth stocks may experience price volatility due to their sensitivity to market fluctuations and dependence on future earnings expectations. Sector allocation references to market capitalization (“smid cap” or “micro caps” etc.) may be subject to special risks given their characteristic narrow markets, limited financial resources, and less liquid stocks, all of which may cause price volatility. International/global investing can involve special risks, such as political changes and currency fluctuations. These risks are heightened in emerging markets. A significant percentage of the underlying investments in aggressive asset allocation portfolio investments have a higher-than-average risk exposure. You should consider your risk tolerance of each of your clients carefully before choosing such a strategy. An investment with multiple underlying investments (which may include asset-allocation or custom blended investments) may be subject to the expenses of those underlying investments in addition to those of the investment itself. Investments may reside in the specialty category due to 1) allowable investment flexibility that precludes classification in standard asset categories and/or 2) investment concentration in a limited group of securities or industry sectors. Investments in this category may be more volatile than less flexible and/or less concentrated investments and may be appropriate as only a minor component in an investor’s overall portfolio. Investment Managers You and your clients should carefully consider investment objectives, risks, charges, and expenses of Funds discussed. This and other important information are contained in the respective Fund prospectuses and summary prospectuses, which should be read carefully before investing. Investment portfolio statistics change over time. Current performance may be lower or higher than return data quoted herein. The investment return and the principal value of an investment will fluctuate; so, an investor’s shares/units, when redeemed, may be worth more or less than their original cost. Verdence relies heavily on unaudited third-party data. Data sources include public data, such as mutual fund data, and non-public data, such as information provided by other investment advisors and managers of limited partnership pooled accounts. Data and/or statistics included on this Portal, including references to performance, opinions, ratings, rankings, manager statistics and demographic information, product, or strategy descriptions, either quantitative or qualitative, are based upon information reasonably available to us as of the applicable date(s) then-published. Information has been obtained from sources that we believe to be reliable, but these sources cannot be guaranteed as to their accuracy or completeness. All data and information produced by a third party has the potential to be incorrect, incomplete, or otherwise misleading. No implication shall be created that the information contained on the Site is correct, including as of any time subsequent to the publish date, and Verdence does not undertake an obligation to update such information at any time after such date. Verdence makes not warranty or representation of the veracity of the data and information and its use of the information should not be implied as an endorsement of any material or statements made. Data, particularly non-public data, is subject to error and where the information is not audited, the potential for error is greater. Where shown, performance information presented is that which has been calculated and presented by an unaffiliated third-party manager. We have no insight into the performance of the advisor/product/account or fund shown and do not attempt to determine whether the performance presented is accurate. Therefore, the performance could be incorrect, overstated or not reflective of actual trading of client funds. There is the potential that the performance shown is a back test and not the result of real investment advice and trading. As such, it could not be relied upon as indicative of future returns of a particular strategy. Where performance shown is that of a pooled account, limited partnership, or private equity fund, you should be aware that there is a significant lack of transparency into the operations and investment process and investment vehicles invested in. As a result, pricing and valuation of the underlying holdings which produced the stated performance could be incorrect, stale, or overstated and therefore the performance figures presented cannot be relied upon. Before investing, we encourage you to request additional information, particularly performance information, of any product that you are considering for your client. You should read, as applicable, the Prospectus, SAI, Composite Disclosure and/or performance disclosure associated with any product that you are considering for investment for your or your client’s. Certain products shown may have account minimums or minimum investment sizes that are unattainable for your clients and therefore they may not be eligible to invest in these products. Reference to registration with the Securities and Exchange Commission (“SEC”) does not imply that the SEC has endorsed or approved the qualifications of Verdence or its respective representatives to provide any advisory services described on the Site.

Read more