Key Takeaways:
- S&P 500 strong start – posts third consecutive year of gains to start the calendar year.
- Second half of year returns solid when first half is positive.
- Not always an easy ride, history suggests bumps ahead.
- Year one of Presidential terms suggest rally can continue.
- Fundamentals and hard data more important to analyze than history.
As Goes the First Half So Goes the Year?
After a volatile start to 2Q25, the S&P 500 was able to recover and post its third consecutive positive start to a year. This is the first time the Index has posted three consecutive positive starts to a calendar year since the 2011 – 2019 period. (The S&P 500 posted a total of nine consecutive positive performances to start the year through 2Q). Given the solid performance in 1H25, we revisited the age old adage “as goes the first half of the year, so goes the rest.” We looked at history to analyze this barometer and provide our expectations for global equity markets through the remainder of 2025.
- What history tells us. The S&P 500 posted a 5.5% price return in the first half of 2025. Going back to 1928, this is less than the historical average of ~9.5% (analyzing only periods of positive 1H return). Going back to 1928, if the S&P posted a positive first half of the year, on average, the Index posted a second half of the year return of ~7%. In addition, the Index was positive ~75% of the time in the second half of the year, following a positive first half. If the S&P posts a positive return in the second half of 2025, it would mark the seventh straight year of second half gains – a streak that hasn’t been reached since 1991 – 1999 (when the index posted nine consecutive positive second half performances).
- Not always an easy ride: A positive first half of the year for the S&P 500 does not necessarily mean the rest of the year will be smooth sailing. In fact, analyzing data going back to 1990 (when data on the VIX Volatility Index was first available), if the S&P was higher in the first half of the year, on average, the VIX increased by 13% in the second half of the year. The VIX was higher in the second half of the year ~60% of the time. In the years that the VIX increased in the second half of the year, the S&P 500 saw a max drawdown of 10%.
- Analyzing Presidential cycles: Going back to 1928, we looked at the first half of the year in year one of a Presidential term (first term or second term). We found that the S&P 500 rises, on average, less than 2% in the first year of a Presidential term and is only positive about 50% of the time. However, in years when it is positive in the first half of the year, the S&P 500 goes on to rise, on average, 10% of the time in the second half and has been positive 100% of the time.
The Bottom Line:
While we like analyzing historical data as a guide, we realize that economic fundamentals and the earnings outlook are more valuable than historical data. The U.S. economy is slowing but not collapsing. This bodes well for equity markets. However, we are also aware that markets can get overly optimistic and push valuations to levels that may be fully reflecting the expected economic outcome. At this time, we think that equity valuations are pricing in the current economic climate and may be complacent to the risks that surround elevated valuations in 2H25. Tariffs and the Fed are the two largest risks we see to equities in 2H25. We do not expect President Trump to extend his pause on tariffs beyond August 1st. In addition, we think the markets are too optimistic about the Fed cutting rates. Both of these factors may add to volatility in 2H25.
LISTEN NOW: Markets With Megan
Your Economic and Market Detailed Recaps
- Headline inflation climbs to highest level since February.
- Consumer spending rises in June.
- Consumer sentiment reaches highest level in five months.
- Global equities rally on positive start to earnings season.
- Short-term yields fall as investors weigh Powell’s future.
- Warm weather forecasts send natural gas prices higher.
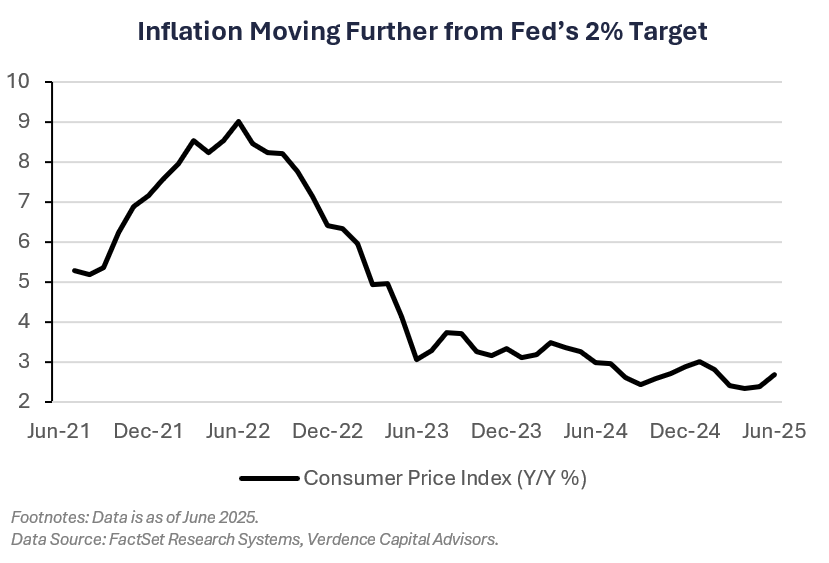
Weekly Economic Recap — Inflation Moves In Wrong Direction
Consumer prices increased moderately in June (+0.3% MoM) pushing the annualized rate to the highest since February (2.7%). Vehicle prices led price declines for the month while tariff-sensitive goods, such as apparel (+0.4% MoM) and household furnishings (+1% MoM), increased. Core inflation, which excludes volatile food and energy prices, increased slighlty less than expected to 2.9% Y/Y.
The Producer Price Index for June increased 2.3% (YoY), the lowest since September 2024. Tariff-sensitive communication equipment led goods prices higher. Total goods prices increased 0.3%, the largest gain since February. Core prices increased at the slowest pace since July 2024 (2.6%).
U.S. retail sales were higher in June compared to last month. Motor vehicle sales were higher for the first time in three months. The control group, which feeds into the government’s GDP calculation, increased 0.5% in June (vs. 0.4% est.). Spending at restaurants and bars, the only service-sector category in the report, advanced 0.6%.
Homebuilder confidence, as tracked by the NAHB, increased slightly in July but at 22, it marked the 15th consecutive month below 50 (a level considered contractionary). Of the builders surveyed, 38% cut prices in July, the highest since the NAHB began tracking the metric in 2022. Prospective buyers’ traffic fell to its lowest reading since the end of 2022.
Consumer sentiment reached its highest level in five months in July according to the University of Michigan Sentiment Index. Year-ahead inflation expectations fell for the second straight month (to 4.4%) while long-run expectations fell for the third straight month (to 3.6%).
Weekly Market Recap — Global Equities Rally; Growth Outperforms
Equities:
The MSCI AC World Index was higher for the third time in the last four weeks. This was as 2Q25 earnings season kicked off and economic data came in relatively strong. U.S. Large-cap growth outperformed with the Nasdaq and S&P 500 each reaching new all-time highs during the week.
Fixed Income:
The Bloomberg Aggregate Index finished the week relatively flat. This was after investors were whipsawed with concern over Fed Chairman Jerome Powell’s future given Trump’s dislike for the Chairman. U.S. TIPS led performance after a slightly hotter-than-expected inflation report.
Commodities/FX:
The Bloomberg Commodity Index was higher for the third straight week. Natural gas prices were higher for the first time in four weeks as hotter-than-normal weather forecasts increased the demand outlook. Soft commodities were higher for the first time in six weeks. Sugar futures rallied to a one-month high after the Trump administration announced tariff import restrictions, leading Pakistan to reduce imports.
WATCH NOW: Alternate View Podcast
Data is as of June 2025.
Source: FactSet Research Systems, Verdence Capital Advisors