WEEKLY INSIGHTS

August 19, 2024
Download PDF

Key Takeaways:

  • Inflation easing but stubborn price pressures remain.
  • Consumers increasing expectations for missing minimum debt payments.
  • Credit card balances sit at record high as delinquency rates climb.
  • Consumers delay home projects as prices
  • Customers focusing on essentials.

Theme of the Week — Consumer Resiliency is Running Thin

Last week, investors were flooded with economic and earnings data that provided further clues on the strength of the consumer. While headline inflation, as tracked by the Consumer Price Index, grew at its slowest annual pace since March 2021, investors may have missed some of the more concerning components of the index that remain subborn. In addition to the inflation report and retail sales report, two consumer bellweathers, Home Depot and Walmart, reported 2Q24 earnings last week which gave further insight into the outlook for the consumer. This week, we provide a deeper look at the state of the consumer through the lens of the most recent data.

  • Inflation is better but still stubborn: There are still sticky inflation pressures challenging consumers that were largely overlooked by the headline CPI number. For instance, shelter jumped 0.4% (MoM) after slowing in June and housing related costs accounted for nearly 90% of the overall headline increase. In addition, services in the CPI report are growing 4.9% (YoY), well above the growth in earnings (3.6% YoY).
  • Were retail sales as good as they showed? Headline retail sales surprisingly jumped (+1.0% MoM) at the fastest pace in 18 months in July. Most of the increase was led by a large jump in sales at auto dealers. However, this may only be a rebound after the steep decline seen in June due to a software outage at dealers from a cyber-attack. When excluding autos, sales rose a modest 0.4%.
  • New York Fed Survey flashes warning signs: Last week, the New York Federal Reserve Survey showed mixed signals for consumers. First, in a positive sign for the economy, the three-year inflation outlook fell to the lowest since at least 2013 (to 2.3%). However, in the near term, those consumers expecting to miss a minimum debt payment rose to the highest since April 2020.
  • Credit usage can’t withstand current levels: TransUnion cites the average credit card balance is ~$6,300, an increase of 4.8% YoY. Delinquency rates are also higher. Over the last year, roughly 9.1% of balances transitioned into delinquency.
  • Home Depot emphasizes challenged consumer: Home Depot reported below consensus 2Q24 earnings. Revenues fell as “consumers are deferring home improvement projects given higher rates,” says CFO Richard McPhail.
  • Walmart is concerned about 2H: While Walmart posted better than expected 2Q24 earnings, the retailer projects a weaker 2H24. The company noted, “customers remain choiceful, value-seeking and focusing on essentials.”

The Bottom Line

There is a lot of focus on the resiliency of the U.S. consumer. Despite July’s retail sales report, we are cautious about the consumer. Credit card debt is at a record high, the average credit card rate is over 20% and in another recent NY Fed survey, Americans that are growing worried about losing their job is at the highest level since 2014. With the labor market weakening and select areas of inflation remaining sticky, this threatens the optimism that the consumer can continue to support growth.

Footnotes: Data is as of August 16, 2024.

Source: Bloomberg Finance LP, Verdence Capital Advisors.

Your Economic and Market Detailed Recaps

Key Takeaways:

  • Small business optimism surprisingly jumps.
  • Headline inflation moving towards Fed’s target.
  • Retail sales climb driven by a surge in auto sales.
  • Global equities jump on better inflation data.
  • Bond yields fall as rate cuts in September priced in.
  • Commodities rally but oil retreats.

Weekly Economic Recap — Inflation Eases Further

NFIB small business optimism increased to the highest level since February 2022 in July. Those companies anticipating the economy to worsen fell to the lowest level since November 2020. Businesses citing plans to raise prices fell the most since April 2020, matching this year’s low.

Producer prices rose modestly in July. While food and energy prices rose, service prices declined. This was the first time service prices declined this year and they fell at the fastest month over month pace since December 2020. At the core level (excluding food, energy and trade) prices rose slightly more than expected (0.3% vs. 0.2% est.).

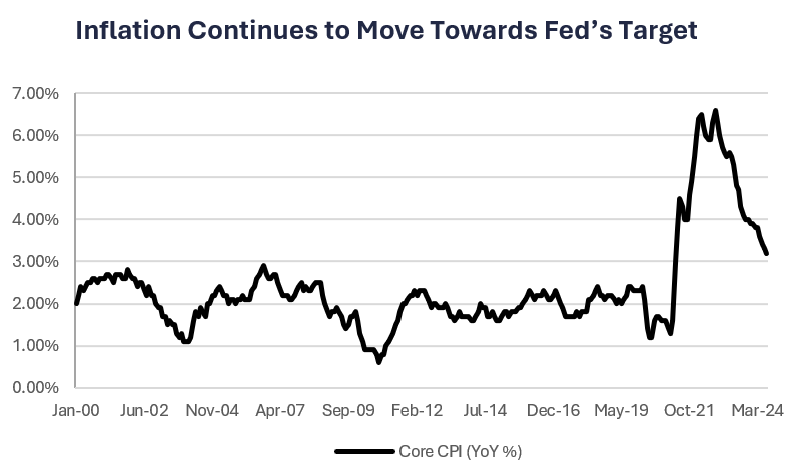
Headline inflation, as tracked by the Consumer Price Index, increased slightly less than the consensus estimate on an annualized basis (2.9% vs. 3.0% est.) and at the slowest pace since March 2021. Shelter costs accounted for 90% of the headline index increase. Core CPI, which exludes volatile food and enery prices, increased at the slowest pace since April 2021 (3.2% YoY).

Consumer spending remained resilient in July as retail sales increased by the most since January 2023. The increase was led by sales of motor vehicles, which accounted for half of the increase. If they were excluded, sales were primarily led by non-discretionary items (e.g., food and beverages). At the core level, which excludes volatile items, including auto sales and gas, prices increased at the slowest pace since April 2024.

Consumer sentiment, as tracked by the University of Michigan Index, increased for the first time in five months. The increase was led by better confidence on future expectations as confidence on current economic conditions declined for the fifth consecutive month.

Weekly Market Recap — Global Equities Rally on Fed Rate Cut Optimism

Equities: The MSCI AC World Index posted its best one week rally since November 2023 as investors priced in rate cuts in September as inflation continues to wane. Developed international equities led the gains (i.e. MSCI EAFE), primarily Japanese equities as the Yen rallied. Within the U.S., technology and growth resumed their leadership as interest rates fell. The S&P 500 outperformed both small and midcap stocks and remains ~2% from its record high reached in July this year.

Fixed Income: The Bloomberg Barclays Aggregate Index rallied for the third time in the past four weeks. Slowing inflation and rate cuts priced in for the September meeting helped push yields lower. Emerging market and investment grade bonds led the gains. In addition, longer term Treasuries outperformed short term Treasuries (10YR vs. 2YR).

Commodities/FX: The Bloomberg Commodity Index rallied for the second consecutive week. However, crude oil slipped for the fifth week out of the past six as fears of Chinese demand were challenged by a weaker economic outlook. Gold prices posted their best one week rally in 19 weeks on hopes for Fed rate cuts.


Data is as of August 9, 2024.
Source: Bloomberg Finance LP, Verdence Capital Advisors.

Disclaimer: © 2024 Authored by Megan Horneman, Chief Investment Officer, Verdence Capital Advisors, LLC

Reproduction without permission is not permitted. The indexes presented are unmanaged portfolios of specified securities and do not reflect any initial or ongoing expenses nor can it be invested in directly. An investment’s portfolio may differ significantly from the securities in the index.  This material was prepared by Verdence Capital Advisors, LLC (“VCA” or “we”, “our”, “us”). VCA believes the information and data in this document were obtained from sources considered reliable and correct and cannot guarantee either their accuracy or completeness. VCA has not independently verified third-party sourced information and data. Any projections, outlooks or assumptions should not be construed to be indicative of the actual events which will occur. These projections, market outlooks or estimates are subject to change without notice. This material is being provided for informational purposes only and is not intended to provide, and should not be relied upon for, investment, accounting, legal, or tax advice. Past performance is not a guarantee of future results. Different types of investments involve varying degrees of risk, and there can be no assurance that the future performance of any specific investment, investment strategy, or product or any non-investment related content, made reference to directly or indirectly in these materials will be profitable, equal any corresponding indicated historical performance level(s), be suitable for your portfolio or individual situation, or prove successful. You should not assume that any discussion or information contained in this report serves as the receipt of, or as a substitute for, personalized investment advice from VCA. Alternative investments are designed only for sophisticated investors who are able to bear the risk of the loss of their entire investment. Investing in alternative investments should be viewed as illiquid and generally not readily marketable or transferable. Investors should be prepared to bear the financial risks of investing in an alternative investment for an indefinite period of time. Due to various factors, including changing market conditions and/or applicable laws, the content may no longer be reflective of current opinions or positions. All indexes are unmanaged, and you cannot invest directly in an index. Index returns do not include fees or expenses. Sector Watch Use of this website is intended for U.S. residents only. Any recommendation, opinion or advice regarding securities or markets contained in such material does not reflect the views of Verdence Capital, and Verdence Capital does not verify any information included in such material. Verdence Capital assumes no responsibility for any fact, recommendation, opinion, or advice contained in any such research material and expressly disclaims any responsibility for any decisions or for the suitability of any security or transaction based on it. Any decisions you may make to buy, sell, or hold a security based on this research will be entirely your own and not in any way deemed to be endorsed or influenced by or attributed to Verdence Capital. It is understood that, without exception, any order based on such research that is placed for execution is and will be treated as an UNRECOMMENDED AND UNSOLICITED ORDER. Further, Verdence Capital assumes no responsibility for the accuracy, completeness, or timeliness of any such research or for updating such research, which is subject to change without notice at any time. Verdence Capital does not provide tax, or legal advice. Under no circumstance is the information contained within this research to be used or considered as an offer to sell or a solicitation of an offer to buy any particular investment/security. Fixed income securities are subject to increased loss of principal during periods of rising interest rates. Fixed income investments are subject to various other risks including changes in credit quality, market valuations, liquidity, prepayments, early redemption, corporate events, tax ramifications and other factors. Lower rated securities are subject to greater credit risk, default risk, and liquidity risk. Commodity‐related products, including futures, carry a high level of risk and are not suitable for all investors. Commodity‐related products may be extremely volatile, illiquid and can be significantly affected by underlying commodity prices, world events, import controls, worldwide competition, government regulations, and economic conditions, regardless of the length of time shares are held. Data is provided for information purposes only and is not intended for trading purposes. Verdence Capital shall not be liable for any errors or delay in the content, or for any action taken in reliance on any content. Weekly Insights/Qtrly & Annual Outlook The indexes presented are unmanaged portfolios of specified securities and do not reflect any initial or ongoing expenses nor can it be invested in directly. An investment’s portfolio may differ significantly from the securities in the index. Semi-Annual Chart Pack Where shown, performance information presented is that which has been calculated and presented by an unaffiliated third-party manager. We have no insight into the performance of the advisor/product/account or fund shown and do not attempt to determine whether the performance presented is accurate. Therefore, the performance could be incorrect, overstated or not reflective of actual trading of client funds. There is the potential that the performance shown is a back test and not the result of real investment advice and trading. As such, it could not be relied upon as indicative of future returns of a particular strategy. Where performance shown is that of a pooled account, limited partnership, or private equity fund, you should be aware that there is a significant lack of transparency into the operations and investment process and investment vehicles invested in. As a result, pricing and valuation of the underlying holdings which produced the stated performance could be incorrect, stale, or overstated and therefore the performance figures presented cannot be relied upon. Before investing, we encourage you to request additional information, particularly performance information, of any product that you are considering for your client. You should read, as applicable, the Prospectus, SAI, Composite Disclosure and/or performance disclosure associated with any product that you are considering for investment for your or your client’s. Products shown may have minimum account sizes or minimum investments which may preclude retail and non-high net worth investors from being able to invest in these products. You should be aware that certain LPs may be closed to new investors and therefore your clients may be prevented from investing in these products. Portfolio Implementation and Rationales The SMA Asset Allocation Models do not represent a personalized recommendation of a particular investment strategy to you or your clients. You should not buy or sell an investment without first considering whether it is appropriate for your client’s portfolio. Additionally, you should review and consider any recent market news. All expressions of opinion are subject to change without notice in reaction to shifting market conditions. Data contained herein from third-party providers is obtained from what are considered reliable sources. However, its accuracy, completeness or reliability cannot be guaranteed. Supporting documentation for any claims or statistical information is available upon request. Examples provided are for illustrative purposes only and not intended to be reflective of results you can expect to achieve. Diversification and asset allocation do not ensure a profit and do not protect against losses in declining markets. Any forecasts contained herein are for illustrative purposes only, may be based upon proprietary research and are developed through analysis of historical public data. Investments in growth stocks may experience price volatility due to their sensitivity to market fluctuations and dependence on future earnings expectations. Sector allocation references to market capitalization (“smid cap” or “micro caps” etc.) may be subject to special risks given their characteristic narrow markets, limited financial resources, and less liquid stocks, all of which may cause price volatility. International/global investing can involve special risks, such as political changes and currency fluctuations. These risks are heightened in emerging markets. A significant percentage of the underlying investments in aggressive asset allocation portfolio investments have a higher-than-average risk exposure. You should consider your risk tolerance of each of your clients carefully before choosing such a strategy. An investment with multiple underlying investments (which may include asset-allocation or custom blended investments) may be subject to the expenses of those underlying investments in addition to those of the investment itself. Investments may reside in the specialty category due to 1) allowable investment flexibility that precludes classification in standard asset categories and/or 2) investment concentration in a limited group of securities or industry sectors. Investments in this category may be more volatile than less flexible and/or less concentrated investments and may be appropriate as only a minor component in an investor’s overall portfolio. Investment Managers You and your clients should carefully consider investment objectives, risks, charges, and expenses of Funds discussed. This and other important information are contained in the respective Fund prospectuses and summary prospectuses, which should be read carefully before investing. Investment portfolio statistics change over time. Current performance may be lower or higher than return data quoted herein. The investment return and the principal value of an investment will fluctuate; so, an investor’s shares/units, when redeemed, may be worth more or less than their original cost. Verdence relies heavily on unaudited third-party data. Data sources include public data, such as mutual fund data, and non-public data, such as information provided by other investment advisors and managers of limited partnership pooled accounts. Data and/or statistics included on this Portal, including references to performance, opinions, ratings, rankings, manager statistics and demographic information, product, or strategy descriptions, either quantitative or qualitative, are based upon information reasonably available to us as of the applicable date(s) then-published. Information has been obtained from sources that we believe to be reliable, but these sources cannot be guaranteed as to their accuracy or completeness. All data and information produced by a third party has the potential to be incorrect, incomplete, or otherwise misleading. No implication shall be created that the information contained on the Site is correct, including as of any time subsequent to the publish date, and Verdence does not undertake an obligation to update such information at any time after such date. Verdence makes not warranty or representation of the veracity of the data and information and its use of the information should not be implied as an endorsement of any material or statements made. Data, particularly non-public data, is subject to error and where the information is not audited, the potential for error is greater. Where shown, performance information presented is that which has been calculated and presented by an unaffiliated third-party manager. We have no insight into the performance of the advisor/product/account or fund shown and do not attempt to determine whether the performance presented is accurate. Therefore, the performance could be incorrect, overstated or not reflective of actual trading of client funds. There is the potential that the performance shown is a back test and not the result of real investment advice and trading. As such, it could not be relied upon as indicative of future returns of a particular strategy. Where performance shown is that of a pooled account, limited partnership, or private equity fund, you should be aware that there is a significant lack of transparency into the operations and investment process and investment vehicles invested in. As a result, pricing and valuation of the underlying holdings which produced the stated performance could be incorrect, stale, or overstated and therefore the performance figures presented cannot be relied upon. Before investing, we encourage you to request additional information, particularly performance information, of any product that you are considering for your client. You should read, as applicable, the Prospectus, SAI, Composite Disclosure and/or performance disclosure associated with any product that you are considering for investment for your or your client’s. Certain products shown may have account minimums or minimum investment sizes that are unattainable for your clients and therefore they may not be eligible to invest in these products. Reference to registration with the Securities and Exchange Commission (“SEC”) does not imply that the SEC has endorsed or approved the qualifications of Verdence or its respective representatives to provide any advisory services described on the Site.

Read more