Key Takeaways:
- Economic Downgrade: OECD lowers global economic growth forecasts.
- Heightened geopolitical and trade risks cited as key issues.
- U.S. growth outlook lower, while inflation expectations rise.
- Bank of England slashes growth expectations in half for 2025.
- Buying opportunities may present themselves amid increased market volatility.
A Global Downgrade Parade
Last week, the Organization for Economic Cooperation and Development (OECD) followed other key central banks by downgrading their estimate for global GDP in 2025 and 2026. The ongoing inflation pressures along with the global trade wars are resulting in a weaker trajectory for economic growth. In this weekly, we highlight the key changes in growth and inflation projections, what that means for investments and our view on the path for economic growth.
- Global economic outlook weaker: The OECD projects global economic growth of 3.1% in 2025, down from its December forecast of 3.3%. Growth is expected to slow further to 3.0% in 2026, also revised down from 3.3% in December. To put this in perspective, the median average annual global GDP growth from 1963-2023 has been 3.5%. The downgrade reflects rising trade tensions and the anticipated supply chain disruptions driven by trade policies. Additionally, geopolitical tensions and protectionist measures have further increased uncertainty around the economic expansion.
- Fed downgrades growth: Along with their interest rate decision, the Federal Reserve released their latest Summary of Economic Projections last week. The committee reported a notable downgrade in GDP growth for 2025 (to 1.7% down from 2.1% in December). Uncertainty around tariffs contributed to their downgrade especially as it coincides with an already slowing economy and fragile consumer.
- Bank of England sees downside risks: In February, the BoE cut its 2025 GDP forecast for the U.K. (to 0.75% from 1.5%). They met last week and while they kept interest rates unchanged, they see “the risks around the near-term outlook for activity in a number of advanced economies…remained to the downside.”
- ECB warns about global growth: On March 6, 2025, the ECB cut rates and reduced economic growth expectations for 2025-2027. In a speech to the European Parliament, ECB President Christine Lagard, warned that “trade frictions are detrimental to global growth and welfare.”
The Bottom Line:
Trade wars can pose a downside risk to growth and upside threat to inflation. However, the direct impact varies across regions and industries. Within the U.S., imports make up ~10% of GDP so we are a bit more insulated than some of our trading partners (e.g., EU, UK, Canada). This may force officials to the negotiating table but can also be an impetus for stimulus in select countries. Within the U.S., the biggest threat to growth is from weak consumer and business spending. We are already dealing with a deterioration in sentiment as consumers have been absorbing years of inflation by increasing credit card debt.
We remain optimistic that negotiations will unfold in the run up to the April 2nd reciprocal tariff deadline and that the bulk of the economic downgrades are behind us. However, from an equity perspective, we have only seen a marginal reduction in S&P 500 earnings (~1% year to date) that may not reflect the weaker economic picture. This should keep volatility high, especially as we hear from companies in 1Q25 earnings season (week of April 7th).
Your Economic and Market Detailed Recaps
- Consumers starting to spend less.
- Homebuilder confidence falls amid tariff fears.
- Fed increases inflation expectations; marks down growth.
- Global equities higher; U.S. snaps losing streak.
- Treasury yields fall as Fed signals potential rate cuts.
- Commodities rally for third straight week.
Weekly Economic Recap — Fed Keeps Rates Unchanged but Signals Higher Degree of Uncertainty
Retail sales rose less-than-expected in February amid worries over an economic slowdown and rising inflation. January’s figures were also revised lower to mark the largest drop since July 2021. Online spending helped support the overall increase for the month as “nonstore retailers” reported a 2.4% month over month increase.
Homebuilder confidence as measured by the NAHB Housing Market Index fell to the lowest level since August (39) amid worries over tariffs, high construction costs, and broad economic uncertainty. Prospective buyer traffic fell to the lowest since the end of 2023.
Housing starts in the U.S. increased in February more than expected as builder incentives increased. Construction increased to an annualized rate of 1.5 million in February, with new construction of single-family homes increasing at the fastest pace in a year (1.11 million).
The Federal Reserve kept interest rates unchanged at their March meeting (4.25% – 4.50%). The release indicated a high degree of uncertainty around the economic outlook and insisted they are not in a hurry to adjust policy. The rate decision was paired with the committee’s Summary of Economic Projections, which showed a steep markdown in economic growth expectations this year to 1.7% (from 2.1% in December) and an increase in PCE Core inflation expectations to 2.8% (from 2.5%).
The Leading Economic Indicators Index decreased for the third straight month in February. Consumers’ expectations of future business conditions and manufacturing new orders weighed on the diffusion index.
Weekly Market Recap — Global Equities Rally as Bond Yields Fall After Fed Meeting
Equities: The MSCI AC World Index was higher for the first time in five weeks. U.S. averages snapped multi-week declines after the Fed signaled the potential for two rate cuts this year. The Russll 1000 Value Index outperformed the Russell 1000 Growth Index for the fifth consecutive week. Shares in Europe were higher on hopes a spending package would drive growth.
Fixed Income: The Bloomberg Aggregate Index was higher for the first time in three weeks after the Fed signaled rate cuts are still expected this year. All sectors of fixed income markets were higher as yields fell (bond prices higher). U.S. TIPS and Investment Grade Corporate bonds led performance.
Commodities/FX: The Bloomberg Commodity Index was higher for the third straight week. Crude oil prices posted their second straight week of gains after fresh U.S. sanctions on Iran and a new OPEC+ plan for some members to cut production. Gold prices were higher for the third straight week as investors sought the safe-haven on geopolitical tensions.
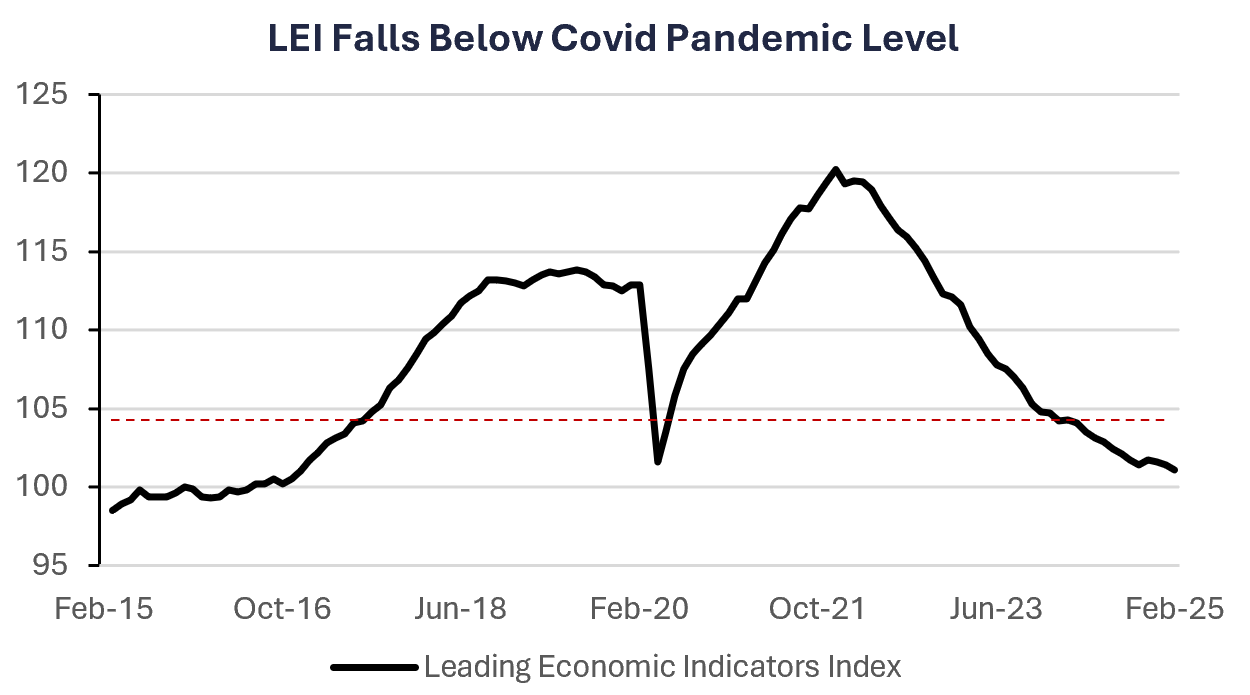
The Leading Economic Indicators Index decreased for the third straight month in February.
Data is as of February 2025.
Source: FactSet Research Systems, Verdence Capital Advisors