WEEKLY INSIGHTS

July 14, 2025
Download PDF

Key Takeaways:

  • Major financial firms kick off 2Q25 earnings season tomorrow.
  • Communication services to lead S&P 500 EPS growth.
  • Technology still strong; semiconductor industry the largest contributor.
  • Large annual drop in oil prices hurting earnings growth for the energy sector.
  • Profit margins strong in 1Q25, but are companies passing increased costs on to consumers?

2Q25 Earnings Season Outlook

The unofficial start to earnings season begins tomorrow with major financial companies slated to release 2Q25 results (e.g., JPMorgan, Wells Fargo). We hope to gain insight into how companies are dealing with economic and political uncertainty. Analysts expect S&P 500 earnings to grow ~5.0% year over year, marking the eighth consecutive quarter of earnings growth.1 It would also mark the slowest growth since 4Q23. This week, we outline what investors can expect from 2Q25 earnings season.

  • Financials take center-stage: Nearly 50% of all S&P 500 companies reporting earnings this week come from the financials sector. Analysts expect the sector to report the fifth-highest annual growth rate of all 11 sectors (2.4%). And analyst expect the major banks industry group to be the largest detractor from growth (-11% YoY) led by JPMorgan Chase. The company’s challenging year-over-year comparison relates to a  $7.9 billion gain in 2Q24 from Visa shares, according to FactSet. Excluding JPMorgan, the industry group would report 9.3% earnings growth.
  • Communications to lead growth: We expect the communication services sector to report the highest year-over-year growth rate of all eleven sectors (+29.6%). Warner Bros. Discovery is expected to lead the sector, benefiting from an easy comparison to last year when the company reported a $9 billion goodwill impairment charge. If the company were excluded from the sector, the growth rate would be 8.2%.
  • Technology strong: The tech sector is expected to report the second-highest growth of all 11 sectors (+16.6%), driven by the semiconductor industry. They are expected to be the largest boost to growth for the tech sector. If the industry were excluded, the growth rate would be 8.6%.
  • Energy weakest: The energy sector is expected to report a year-over-year earnings decline of -25.8%. The sector was challenged by lower oil prices (average of $80.9 usd/bbl in 2Q24 vs. $63.9 in 2Q25). Oil prices were lower driven by geopolitical tensions impacting the global supply/demand outlook.
The Bottom Line:

According to FactSet, over the last ten years, the final earnings reported by companies exceeded expectations by ~7.0%. If we apply this figure to the current estimate, S&P 500 earnings could grow above ~10% which would be the fourth out of the past five quarters seeing double-digit earnings growth. We welcome strong earnings but we are more interested in what companies are saying about the future path of earnings.

We will be watching how companies are handling the current tariffs and budgeting for the future given the uncertainty. Also, we will monitor which sectors are passing on higher costs and which sectors are taking a hit on margins. And we will assess what is being reported about the “One Big Beautiful” tax bill, especially how recent regulatory changes may aid future earnings (e.g. Financials). In addition, are companies increasing capex spending due to favorable expensing measures? Lastly, what are companies saying about the labor market? The labor market has been strong, but cracks are emerging and may affect the economic outlook.

LISTEN NOW: Markets With Megan

Your Economic and Market Detailed Recaps

  • Consumer borrowing slows driven by revolving credit.
  • Fed officials’ uncertainty still elevated driven by tariff impact.
  • U.S. government posts budget surplus amid tariff receipts.
  • Global equities lower on increased tariff rhetoric.
  • U.S. Treasury yields higher; investors reprice inflation.
  • Commodities driven higher by oil and copper prices.

Weekly Economic Recap — Fed Rate Expectations Diverge Amid Uncertain Tariff Impact

Sentiment among small business owners fell slightly in June as owners continued to contend with Trump’s tax bill (the survey was completed before the House vote). Nearly 20% of firms (by the NFIB) ranked taxes as the most important problem, the highest in ~four years. Inventories were the largest detractor from optimism, as some reported stockpiles as being too high.

U.S. consumer borrowing increased at the slowest pace in three months in May driven by a pullback in revolving debt. Revolving credit (which includes credit card balances) declined $3.5 billion, the first decrease since November. The average rate on credit card accounts with assessed interest was 22.25% in May, close to the highest since 1995.

The minutes from the June FOMC meeting showed diverging expectations on the appropriate monetary policy path, driven by how tariffs might affect inflation. “Most participants noted the risk that tariffs could have more persistent effects on inflation, while a few participants noted tariffs would lead to a one-time increase in prices.” However,  most policymakers assessed that “some reduction” in interest rates would be appropriate this year.

The U.S. government posted a surprise budget surplus in June as tariff receipts surged. Customs duties totaled $27 billion in June, ~300% higher compared to a year ago. Net interest payments on the national debt totaled $84 billion in June, climbing to $749 billion for the fiscal year thus far.

Weekly Market Recap — Global Equities Fall Amid Increased Tariff Rhetoric; Growth Outperforms

Equities:

The MSCI AC World Index was lower for the first time in three weeks as President Trump reignited tariff fears. All major U.S. averages were lower to finish the week but tech (i.e., Nasdaq) outperformed on a relative basis. The Dow Jones Industrial Average was lower for the first time in four weeks and was the weakest performing average as investors rotated into growth sectors. European markets finished broadly higher on optimism of trade negotiations still on the table.

Fixed Income:

The Bloomberg Aggregate Index was lower for the second consecutive week as Treasury yields inched higher on concern that higher tariffs could fuel inflation. Floating rate instruments, Municipals and U.S. TIPS were among the best performing sectors while long term Treasuries and investment grade credit led the weakness.

Commodities/FX:

The Bloomberg Commodity Index was higher for the second straight week. Crude oil prices finished the week higher as investors weigh tariff implications on global supply/demand. Copper prices were higher after Trump threatened a 50% tariff on the  metal.

WATCH NOW: Alternate View Podcast

chart graph 2Q25 earnings season outlook


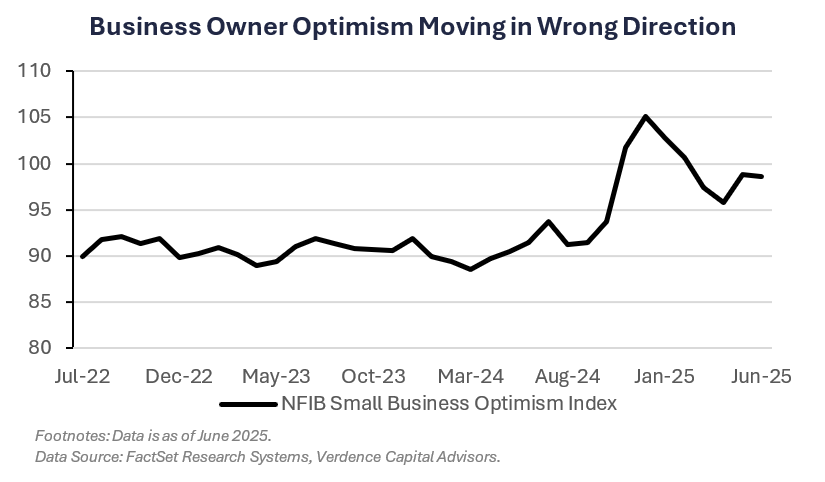
Data is as of June 2025.
Source: FactSet Research Systems, Verdence Capital Advisors

Disclaimer: © Verdence Capital Advisors, LLC

Reproduction without permission is not permitted. The indexes presented are unmanaged portfolios of specified securities and do not reflect any initial or ongoing expenses nor can it be invested in directly. An investment’s portfolio may differ significantly from the securities in the index.  This material was prepared by Verdence Capital Advisors, LLC (“VCA” or “we”, “our”, “us”). VCA believes the information and data in this document were obtained from sources considered reliable and correct and cannot guarantee either their accuracy or completeness. VCA has not independently verified third-party sourced information and data. Any projections, outlooks or assumptions should not be construed to be indicative of the actual events which will occur. These projections, market outlooks or estimates are subject to change without notice. This material is being provided for informational purposes only and is not intended to provide, and should not be relied upon for, investment, accounting, legal, or tax advice. Past performance is not a guarantee of future results. Different types of investments involve varying degrees of risk, and there can be no assurance that the future performance of any specific investment, investment strategy, or product or any non-investment related content, made reference to directly or indirectly in these materials will be profitable, equal any corresponding indicated historical performance level(s), be suitable for your portfolio or individual situation, or prove successful. You should not assume that any discussion or information contained in this report serves as the receipt of, or as a substitute for, personalized investment advice from VCA. Alternative investments are designed only for sophisticated investors who are able to bear the risk of the loss of their entire investment. Investing in alternative investments should be viewed as illiquid and generally not readily marketable or transferable. Investors should be prepared to bear the financial risks of investing in an alternative investment for an indefinite period of time. Due to various factors, including changing market conditions and/or applicable laws, the content may no longer be reflective of current opinions or positions. All indexes are unmanaged, and you cannot invest directly in an index. Index returns do not include fees or expenses. Sector Watch Use of this website is intended for U.S. residents only. Any recommendation, opinion or advice regarding securities or markets contained in such material does not reflect the views of Verdence Capital, and Verdence Capital does not verify any information included in such material. Verdence Capital assumes no responsibility for any fact, recommendation, opinion, or advice contained in any such research material and expressly disclaims any responsibility for any decisions or for the suitability of any security or transaction based on it. Any decisions you may make to buy, sell, or hold a security based on this research will be entirely your own and not in any way deemed to be endorsed or influenced by or attributed to Verdence Capital. It is understood that, without exception, any order based on such research that is placed for execution is and will be treated as an UNRECOMMENDED AND UNSOLICITED ORDER. Further, Verdence Capital assumes no responsibility for the accuracy, completeness, or timeliness of any such research or for updating such research, which is subject to change without notice at any time. Verdence Capital does not provide tax, or legal advice. Under no circumstance is the information contained within this research to be used or considered as an offer to sell or a solicitation of an offer to buy any particular investment/security. Fixed income securities are subject to increased loss of principal during periods of rising interest rates. Fixed income investments are subject to various other risks including changes in credit quality, market valuations, liquidity, prepayments, early redemption, corporate events, tax ramifications and other factors. Lower rated securities are subject to greater credit risk, default risk, and liquidity risk. Commodity‐related products, including futures, carry a high level of risk and are not suitable for all investors. Commodity‐related products may be extremely volatile, illiquid and can be significantly affected by underlying commodity prices, world events, import controls, worldwide competition, government regulations, and economic conditions, regardless of the length of time shares are held. Data is provided for information purposes only and is not intended for trading purposes. Verdence Capital shall not be liable for any errors or delay in the content, or for any action taken in reliance on any content. Weekly Insights/Qtrly & Annual Outlook The indexes presented are unmanaged portfolios of specified securities and do not reflect any initial or ongoing expenses nor can it be invested in directly. An investment’s portfolio may differ significantly from the securities in the index. Semi-Annual Chart Pack Where shown, performance information presented is that which has been calculated and presented by an unaffiliated third-party manager. We have no insight into the performance of the advisor/product/account or fund shown and do not attempt to determine whether the performance presented is accurate. Therefore, the performance could be incorrect, overstated or not reflective of actual trading of client funds. There is the potential that the performance shown is a back test and not the result of real investment advice and trading. As such, it could not be relied upon as indicative of future returns of a particular strategy. Where performance shown is that of a pooled account, limited partnership, or private equity fund, you should be aware that there is a significant lack of transparency into the operations and investment process and investment vehicles invested in. As a result, pricing and valuation of the underlying holdings which produced the stated performance could be incorrect, stale, or overstated and therefore the performance figures presented cannot be relied upon. Before investing, we encourage you to request additional information, particularly performance information, of any product that you are considering for your client. You should read, as applicable, the Prospectus, SAI, Composite Disclosure and/or performance disclosure associated with any product that you are considering for investment for your or your client’s. Products shown may have minimum account sizes or minimum investments which may preclude retail and non-high net worth investors from being able to invest in these products. You should be aware that certain LPs may be closed to new investors and therefore your clients may be prevented from investing in these products. Portfolio Implementation and Rationales The SMA Asset Allocation Models do not represent a personalized recommendation of a particular investment strategy to you or your clients. You should not buy or sell an investment without first considering whether it is appropriate for your client’s portfolio. Additionally, you should review and consider any recent market news. All expressions of opinion are subject to change without notice in reaction to shifting market conditions. Data contained herein from third-party providers is obtained from what are considered reliable sources. However, its accuracy, completeness or reliability cannot be guaranteed. Supporting documentation for any claims or statistical information is available upon request. Examples provided are for illustrative purposes only and not intended to be reflective of results you can expect to achieve. Diversification and asset allocation do not ensure a profit and do not protect against losses in declining markets. Any forecasts contained herein are for illustrative purposes only, may be based upon proprietary research and are developed through analysis of historical public data. Investments in growth stocks may experience price volatility due to their sensitivity to market fluctuations and dependence on future earnings expectations. Sector allocation references to market capitalization (“smid cap” or “micro caps” etc.) may be subject to special risks given their characteristic narrow markets, limited financial resources, and less liquid stocks, all of which may cause price volatility. International/global investing can involve special risks, such as political changes and currency fluctuations. These risks are heightened in emerging markets. A significant percentage of the underlying investments in aggressive asset allocation portfolio investments have a higher-than-average risk exposure. You should consider your risk tolerance of each of your clients carefully before choosing such a strategy. An investment with multiple underlying investments (which may include asset-allocation or custom blended investments) may be subject to the expenses of those underlying investments in addition to those of the investment itself. Investments may reside in the specialty category due to 1) allowable investment flexibility that precludes classification in standard asset categories and/or 2) investment concentration in a limited group of securities or industry sectors. Investments in this category may be more volatile than less flexible and/or less concentrated investments and may be appropriate as only a minor component in an investor’s overall portfolio. Investment Managers You and your clients should carefully consider investment objectives, risks, charges, and expenses of Funds discussed. This and other important information are contained in the respective Fund prospectuses and summary prospectuses, which should be read carefully before investing. Investment portfolio statistics change over time. Current performance may be lower or higher than return data quoted herein. The investment return and the principal value of an investment will fluctuate; so, an investor’s shares/units, when redeemed, may be worth more or less than their original cost. Verdence relies heavily on unaudited third-party data. Data sources include public data, such as mutual fund data, and non-public data, such as information provided by other investment advisors and managers of limited partnership pooled accounts. Data and/or statistics included on this Portal, including references to performance, opinions, ratings, rankings, manager statistics and demographic information, product, or strategy descriptions, either quantitative or qualitative, are based upon information reasonably available to us as of the applicable date(s) then-published. Information has been obtained from sources that we believe to be reliable, but these sources cannot be guaranteed as to their accuracy or completeness. All data and information produced by a third party has the potential to be incorrect, incomplete, or otherwise misleading. No implication shall be created that the information contained on the Site is correct, including as of any time subsequent to the publish date, and Verdence does not undertake an obligation to update such information at any time after such date. Verdence makes not warranty or representation of the veracity of the data and information and its use of the information should not be implied as an endorsement of any material or statements made. Data, particularly non-public data, is subject to error and where the information is not audited, the potential for error is greater. Where shown, performance information presented is that which has been calculated and presented by an unaffiliated third-party manager. We have no insight into the performance of the advisor/product/account or fund shown and do not attempt to determine whether the performance presented is accurate. Therefore, the performance could be incorrect, overstated or not reflective of actual trading of client funds. There is the potential that the performance shown is a back test and not the result of real investment advice and trading. As such, it could not be relied upon as indicative of future returns of a particular strategy. Where performance shown is that of a pooled account, limited partnership, or private equity fund, you should be aware that there is a significant lack of transparency into the operations and investment process and investment vehicles invested in. As a result, pricing and valuation of the underlying holdings which produced the stated performance could be incorrect, stale, or overstated and therefore the performance figures presented cannot be relied upon. Before investing, we encourage you to request additional information, particularly performance information, of any product that you are considering for your client. You should read, as applicable, the Prospectus, SAI, Composite Disclosure and/or performance disclosure associated with any product that you are considering for investment for your or your client’s. Certain products shown may have account minimums or minimum investment sizes that are unattainable for your clients and therefore they may not be eligible to invest in these products. Reference to registration with the Securities and Exchange Commission (“SEC”) does not imply that the SEC has endorsed or approved the qualifications of Verdence or its respective representatives to provide any advisory services described on the Site.

Read more