
On November 3, Americans will vote in the 2026 midterm elections with every House seat, 35 Senate seats and 39 Governorships on the ballot. We will get a better picture of voter turnout closer to the election, but we do know that the past two midterm elections saw near-record-high voter turnout. With consumer confidence near a record low, the U.S. in a prolonged war with Iran, inflationary pressures accelerating, interest rates surging and uncertainty around the impact of artificial intelligence, we expect another solid participation in this midterm election.
Political officials are trying to capitalize on Americans’ frustration, as seen by campaign spending. According to nonpartisan firm AdImpact, candidates are spending ~$12 billion on political advertising for the upcoming elections. This would be more than the 2022 midterm elections (~$9 billion) and exceed the 2024 Presidential election (~$11 billion).
In this white paper, we will not voice political opinion. Instead, we will focus on the key issues that Americans are considering when they head to the polls in November (we will avoid societal issues such as immigration, crime, and abortion). In addition, we will look at history and what past midterm elections and Presidential cycles have meant for the economy and financial markets. The analysis we offer in this white paper on the economy and the performance of financial markets surrounding midterm elections is simply using history as a guide. In these highly volatile times, it would be irresponsible to use only history as the deciding factor when making investment decisions. However, it is interesting to acknowledge patterns seen during and after past midterm elections.
Key Economic Topics in the Upcoming Midterm Election
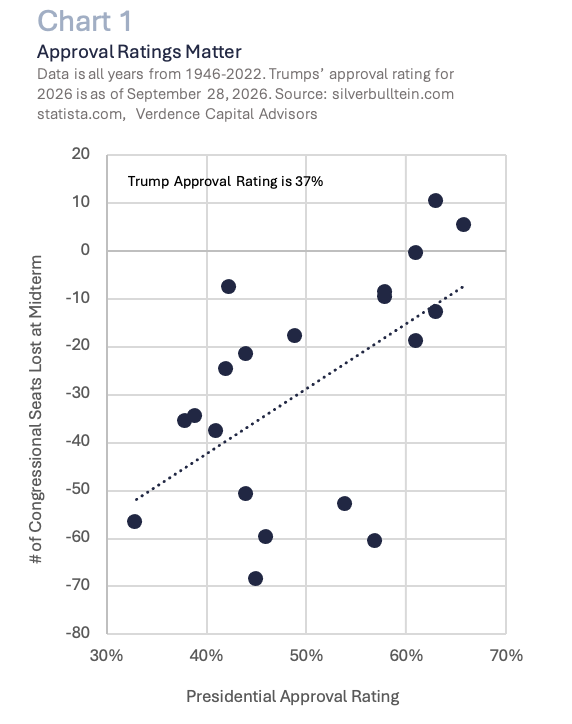
The midterm elections are considered a report card for the President and his party on the health of the economy midway through the President’s four-year term. Historically, there has been a high correlation between the President’s approval rating at the time of the midterm election and the number of seats the President’s party wins or loses in Congress (Chart 1). With President Trump’s approval rating sitting below (37%) the historical average seen at midterm elections (48%) for all Presidents going back to President Truman in 1946, the Republican Party may be facing a challenging election.1 Below, we focus on the key economic topics that are at the forefront of voters’ minds and what may be influential in deciding the upcoming election.
- Cost of Living
- Heathcare
- Housing Affordability
- Impact of War In Iran
- AI Data Centers
Cost of Living
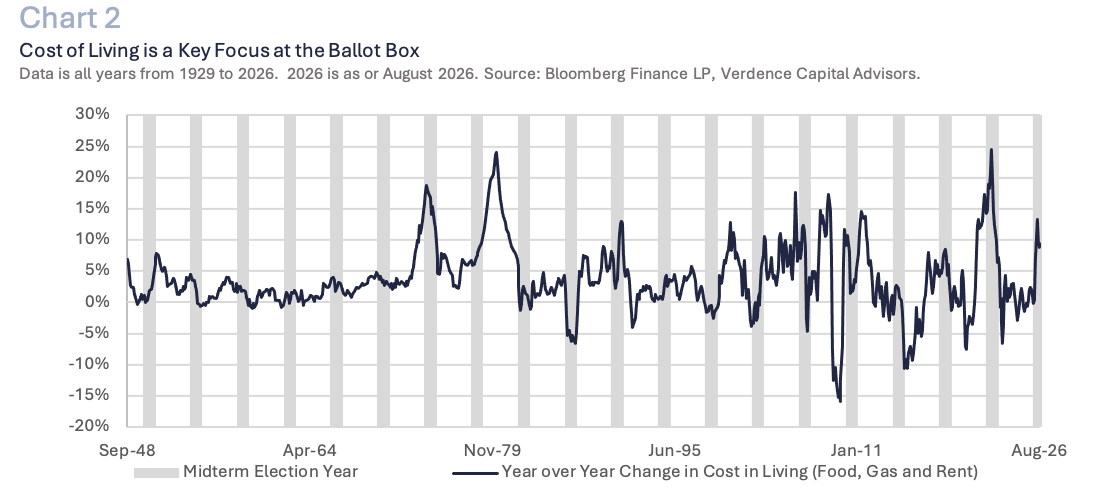
Inflation and the cost of living have been a problem since the last administration. In fact, core PCE, which is the Fed’s preferred inflation gauge, has been above the Fed’s target rate (2.0%) for the past 66 consecutive months. If we look at the Consumer Price Index and only include food, gas, and shelter as a gauge of the cost of living, it is rising at the fastest rate since the inflation-induced period after COVID (2022). (Chart 2) In addition, in a recent survey by Reuters/Ipsos, more than 70% of those Americans surveyed disapprove of the way that President Trump is handling the rising cost of living.2
Healthcare
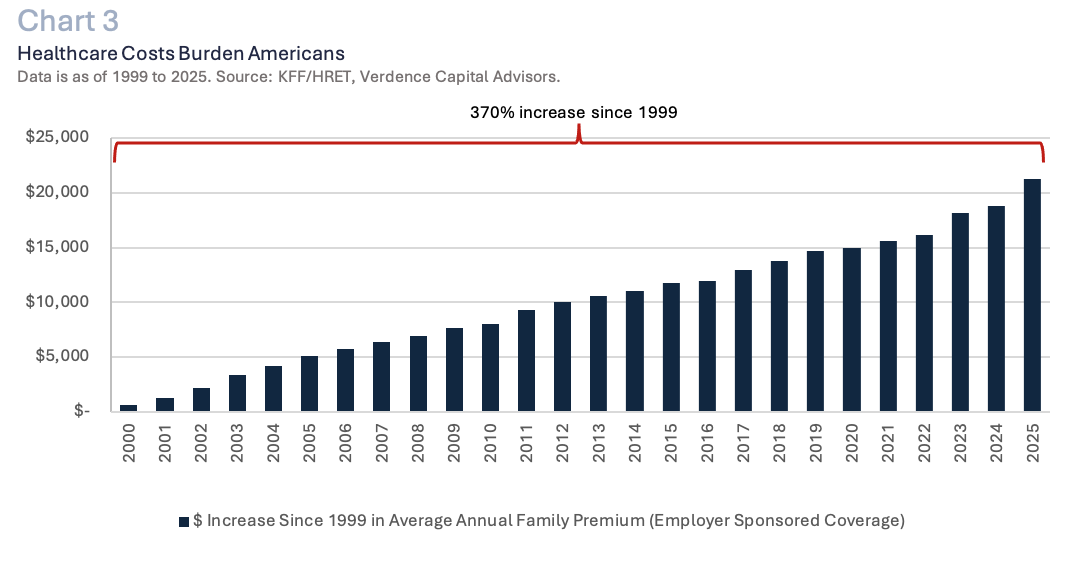
The cost of healthcare is consistently a key issue on voters’ minds. According to KFF, a nonpartisan health policy research organization, more than 50% of Americans disapprove of Trump’s handling of healthcare. Healthcare premiums from employer-sponsored covered plans have increased 370% since 1999. (Chart 3). In addition, ACA marketplace insurers are proposing a 15% median premium increase in 2027, which is on top of a 20% median increase that took place in 2026.
Housing Affordability
Housing has been facing structural headwinds for some time, and housing affordability for first-time homebuyers has been hovering at a record low for the past four years. Weak affordability is not just due to the rise in mortgage rates (7.3% as of September 25, 2026), but home prices have been out of reach for many Americans due to decades of underbuilding. According to Realtor.com, the U.S. has a cumulative shortfall of over 4 million homes, which is the third-largest annual deficit since 2012. This has contributed to the median price of an existing home rising to a record high of $429K. To put this in perspective, according to Redfin’s affordability report released in August 2026, the typical American homebuyer now needs to spend 38% of their income to buy the median-priced home nationally.
Impact of War in Iran
The President’s actions against Iran had little support from the start. Now that the war has extended into its eighth month, opposition has been steadily building. In fact, according to polling by Quinnipiac, ~50% of Americans disagreed with the war in early March, and in a survey in late July, 60% opposed it. In addition, in a recent survey by Reuters/Ipsos, over 80% of respondents expect the war to continue for a prolonged period.3
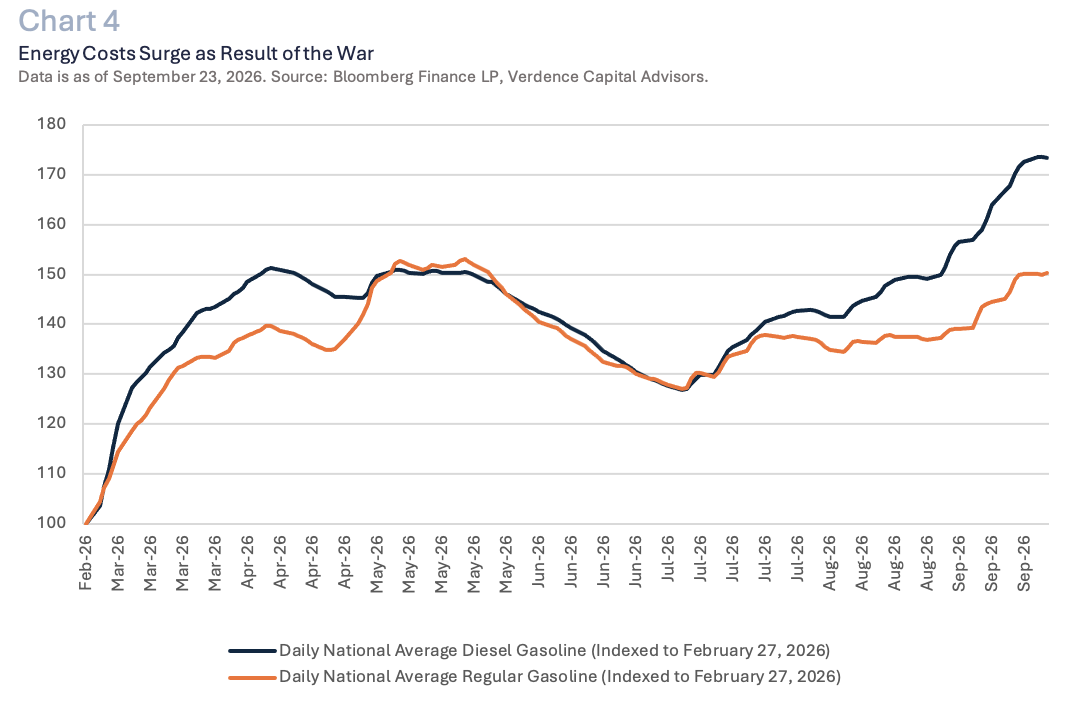
The primary reason for the discontent surrounds the rise in energy prices. The national average price of a gallon of regular gasoline has increased 50% to the highest since 2022 (up $1.50 a gallon to $4.48). (Chart 4). While gasoline negatively impacts households, the surge in diesel prices hurts the broad economy. Diesel prices have increased to a record high ($6.53 a gallon on September 21, 2026), and according to the American Trucking Association, 73% of the nation’s freight is moved with diesel-powered trucks. That often directly spills into inflation.
AI Data Centers
A more unique concern in this midterm election has been the growing frustration over data center construction tied to the AI buildout. Especially since the cost of living is already burdensome and now electricity prices are surging in states that are closely tied to the building of data centers. A recent Fox News Poll showed that over 70% of those polled opposed building AI data centers in their own area.4 According to Ballotpedia’s tracking, there are 38 data center-related ballot measures across eight states this cycle.5 A state like Ohio, which has been a part of the data center boom, has 20 measures across 17 different jurisdictions. Some states and local jurisdictions have already proposed or enacted moratoriums around the building of data centers (e.g., New York, Woodford County, Kentucky, Lima, Ohio).
The Economy and Midterm Elections
Despite all the headwinds facing Americans, the U.S. economy has been growing at a solid pace this year. Aggressive capex spending surrounding AI and Americans who have been resilient with personal spending have helped support GDP. It is interesting to note that historically, the second year of the Presidential term (also midterm election year) has been the weakest for GDP. With history as a guide (Chart 5), the expansion should continue into 2027 and 2028, as those two years have been the strongest for GDP in a Presidential election term. In addition, of all the recessions going back to 1930, only one recession started in year three of the Presidential term (year three will be 2027), and that was the start of the Great Recession in 2007.
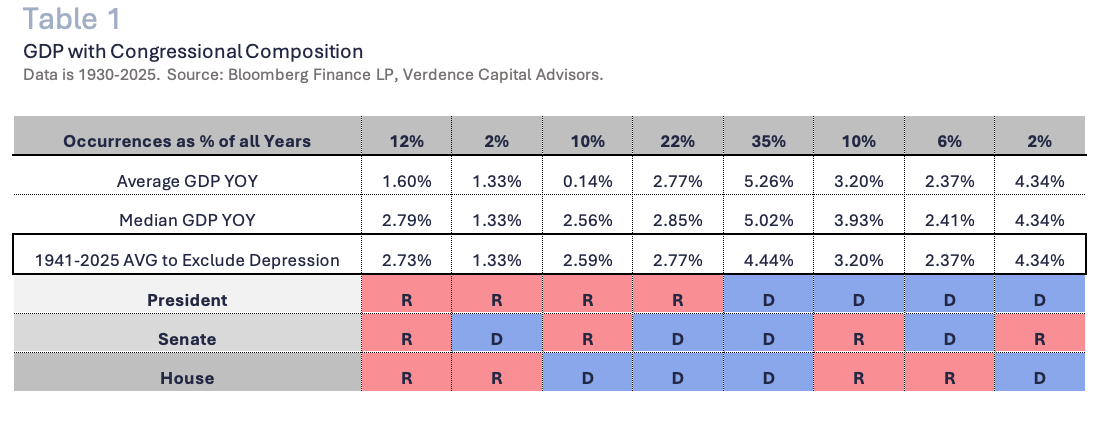
From an economic standpoint, history tells us that the best combination for the Government in the upcoming midterm election would be for the Democrats to win control over the Senate and the House. Going back to 1929, the average annual GDP growth in that combination has been 2.77%. (Table 1). The online prediction market, Polymarket, currently gives this a probability of ~65%. 6 Since 1929, excluding the Great Depression, the S&P 500 has tended to perform better when the President’s party lacked full control of Congress, likely because split control limits large policy initiatives.

The Equity Market and Midterm Elections
When we deliver our findings about midterm elections and the historical relationship with equity performance, we must remind investors about the common financial term that past performance is not indicative of future results. This economic environment is highly complex. There are many other factors influencing the equity markets than just politics. This includes the chance we are reaching a peak in earnings and uncertainty around how much the Federal Reserve will need to raise interest rates. Also, how much damage rate hikes will inflict on the economy and whether the Fed will be successful in finally tackling inflation.
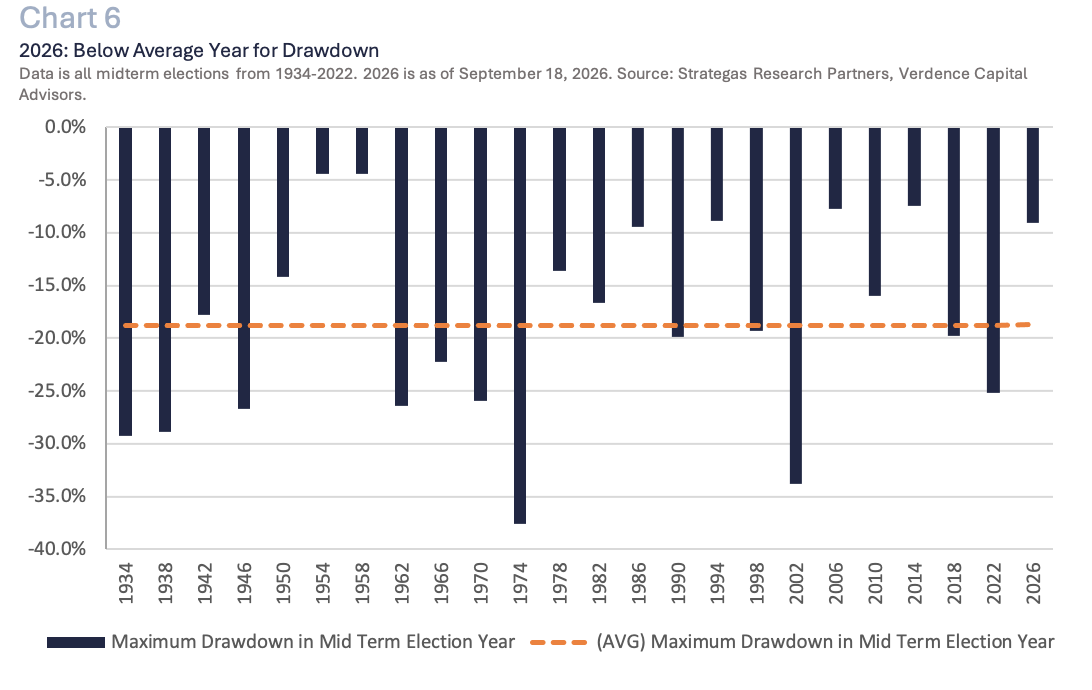
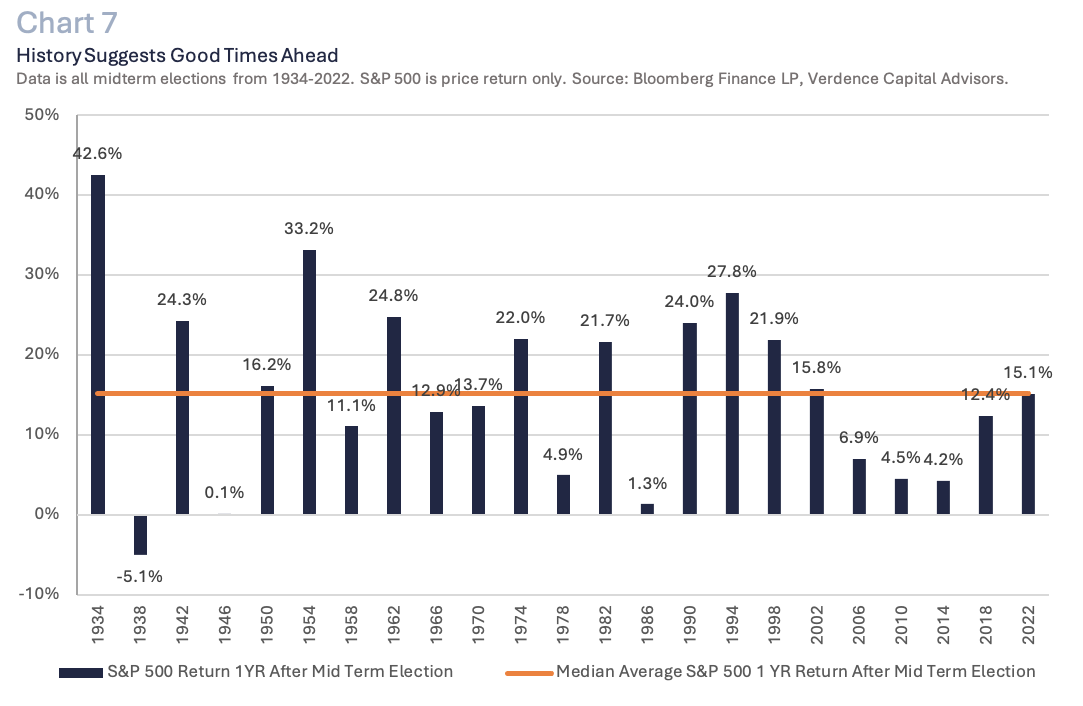
What we can draw from history is that midterm election years tend to be much more volatile than we have seen this year. The average drawdown in a midterm election year has been 18.6% since 1934. But as illustrated, the 9% drawdown thus far this year is roughly half of what we see in a midterm election year. (Chart 6). However, as we move into year-end and with markets getting more volatile, if the equity weakness continues, history suggests it should be used as a buying opportunity. Historically, the year after midterm elections is a favorable time for equity returns regardless of the economic environment. As can be seen in Chart 7, there has only been one time in history that the S&P 500 was negative in the one year after a midterm election date (i.e., 1938), and the index is positive, on average, ~15%.
This economic environment is highly complex, and there are many other factors influencing the equity markets besides politics.
Verdence View
While we are cognizant that using history to draw future comparisons may be an interesting exercise, it may also mislead investors. It is important to note that every midterm election year was accompanied by a different economic, interest rate and political climate. At this time, the Congressional race in the U.S. is still tight and we are not going to speculate on what key issues either party will tackle first. Instead, we will focus on what we know and continue to focus on economic fundamentals and asset class valuations when considering asset allocation. There are a few factors we can draw from history and the current environment which include:
Equities like gridlock.
Equities have historically preferred a split Congress and/or White House. Going back to 1929 and excluding the Great Depression, some of the best annual returns for the S&P 500 have been when the sitting President does not have full control over both sides of Congress. This may be because markets do not expect major changes to law with a split Congress.
Selectivity and active management.
With valuations stretched and earnings expectations extremely optimistic, we see room for disappointment in the next 12 months. There will be winners and losers in the race to be the leader in artificial intelligence, so it is crucial to be selective and focus on active management.
Next stop is the Presidential race!
We know that President Trump will not be running in 2028, but the midterm election is usually the start of preparation for candidates for the upcoming Presidential race. We do know Democrats will be searching for a winnable candidate. This will make 2027 an interesting political climate.
If you have any questions or comments, please feel free to reach out to your financial advisor.
Past performance is not indicative of future returns.
- Trump Approval Rating: Latest Polls | Silver Bulletin
- As of September 21, 2026.
- As of September 11-14, 2026.
- As of September 23, 2026.
- As of September 24, 2026.
Megan Horneman | Chief Investment Officer
Megan leads Verdence’s research and sets the firm’s economic outlook. She chairs the Verdence Investment Committee, which decides how client portfolios are divided among stocks, bonds, and other investments.
Her work focuses on how large forces like elections, inflation, interest rates, and energy prices affect the economy and markets. She studies decades of market history to find patterns, then weighs them against today’s conditions before drawing conclusions. Her analysis stays nonpartisan and centers on what policy shifts may mean for households and portfolios.
Megan appears regularly on Fox Business, CNBC, Bloomberg, and Yahoo Finance and hosts the Markets with Megan podcast. Before joining Verdence, she spent 12 years at Deutsche Bank as a Director and Senior Investment Strategist, serving on several global and regional investment committees for its Wealth Management Division. She began her career in the Fixed Income Research and Strategy group at Legg Mason, building the bond and interest rate background she draws on today.
