White Paper Report

2025 Q2 White Paper: The ABC’s of Tariffs

April 24, 2025
Download PDFWatch Video

The ABC’s of Tariffs

Tariffs have dominated the headlines this year as President Trump has aggressively acted on his “America First” trade policy by imposing a universal tariff on all imports coming into the U.S. and dramatically increasing tariffs on many global trading partners. While there is currently a temporary hold on most tariffs, the trade war has intensified between the U.S. and China.

The uncertainty about the damage to the global economy and corporate earnings has fueled volatility for global investors. The S&P 500 Index has flirted with bear market territory (a drop of 20% or more). Also small cap stocks entered bear market territory. And many international indices have fallen into correction territory (a drop of 10% or more). Consumer sentiment has deteriorated, earnings estimates are falling, recession risks are rising and the tariff impact on inflation is highly uncertain.

President Trump’s trade policy was a campaign promise to “level the playing field” from a global trade perspective. The use of tariffs was also a focal point of his first term in office with some tariffs even remaining in place through Biden’s presidency. What is rattling investors this time is the speed and scope at which he is using tariffs to “reorder global trade.”

In this quarterly white paper, we offer a nonpartisan explanation of the state of our trade deficit and why President Trump is using tariffs as a primary tool in his trade policy. Lastly, we will offer our opinion about what tariffs mean for the economy and asset classes.

Understanding the U.S. Trade Deficit

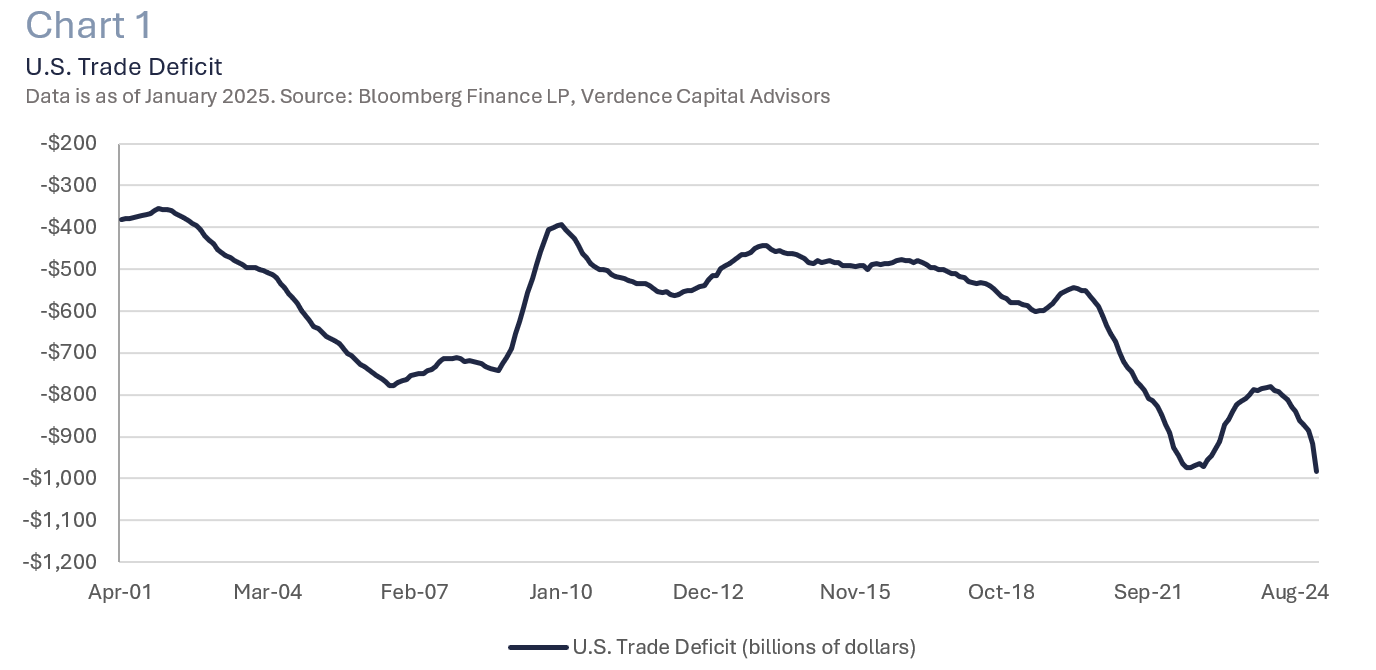
The U.S. runs a trade deficit where we import more than we export. Economists have studied the reasons and risks of the U.S. trade deficit for decades and there are several documented factors that have contributed to the deficit ballooning to ~$1 trillion. The deficit has been up more than 100% since 2000 and makes up ~3% of GDP. (Chart 1). Some reasons include:

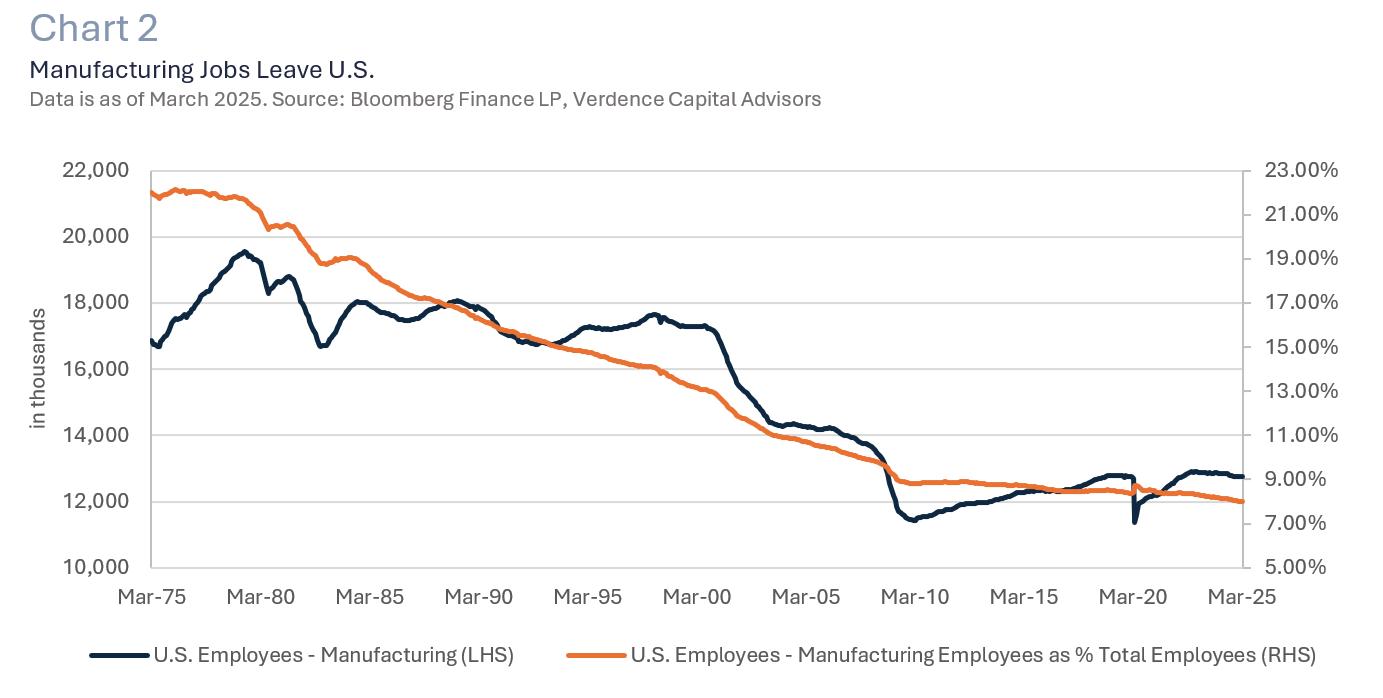
  • The rise of globalization, specifically at the turn of the century with China joining the World Trade Organization. Foreign countries make goods cheaper than we can in the U.S. Unfortunately, U.S. manufacturing has been a victim of globalization. The U.S. has lost ~7 million manufacturing jobs over the past 25 years and manufacturing jobs have gone from making up over 20% of our non-farm payrolls to under 10%. (Chart 2). In addition, the Economic Policy Institute reports that between 1998-2019 the U.S. saw the closure of nearly 70,000 factories. This also devastated certain U.S. geographic locations (e.g., The Rust Belt).1
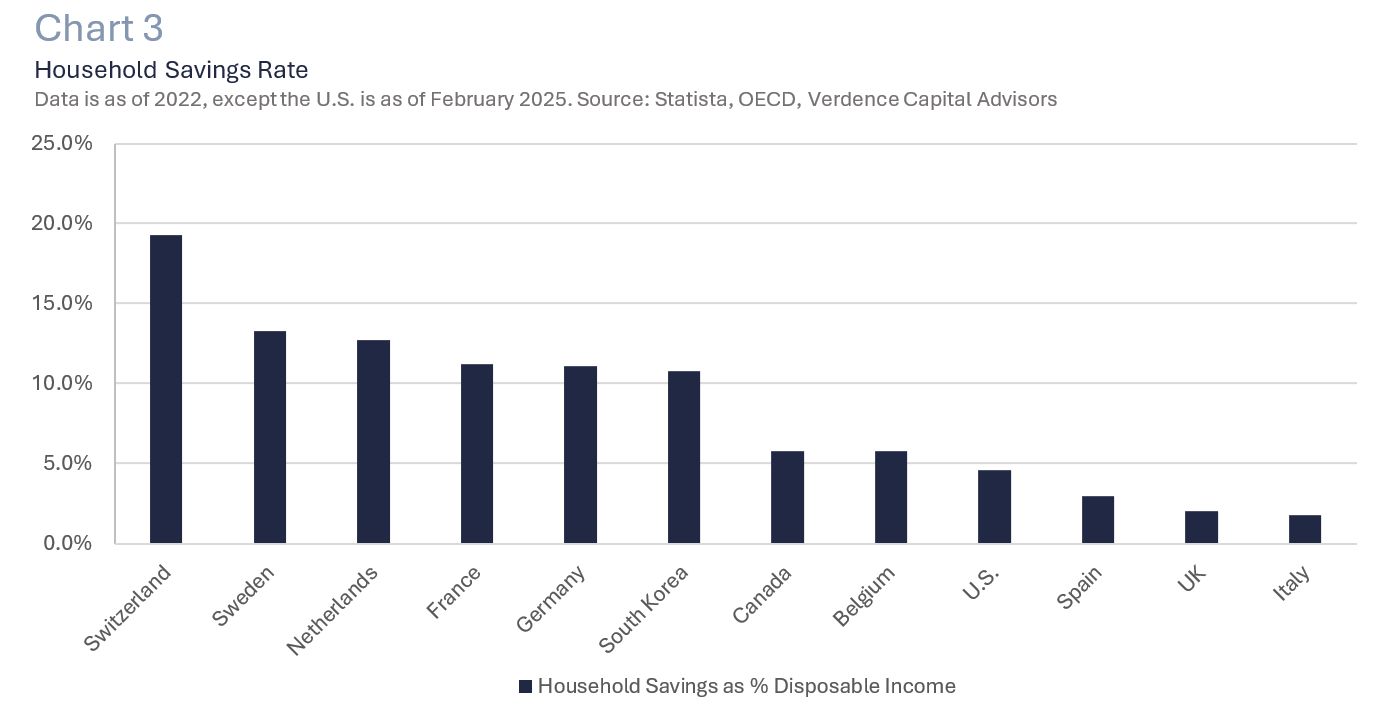
  • Americans are not savers. The American consumer makes up 25-30% of global consumption but only makes up 4% of the global population.2 Americans do not save like other developed economies. Instead we spend, and a lot of that spending is in the form of goods (Chart 3), especially cheap goods. While the U.S. is a service-oriented economy, services are not as easy to export as goods. Therefore our exports are lower than our imports.
  • Strong dollar hurts U.S. companies. The U.S. dollar has fluctuated against many different currencies throughout different economic cycles. However, the U.S. Dollar Index is ~20% higher today than in 1980. A strong dollar makes imports cheaper for Americans and American exports more expensive for other countries. This exacerbates the imbalance of imports and exports.


Chart of the US Trade Deficit as of January 2025 tariffs


Chart showing number of manufacturing jobs from 1975 to 2025


Chart of Household Savings as Disposable Income


Why is Trump Using Tariffs?

The initial tariffs that Trump implemented on Mexico and Canada were in retaliation for the immigration and fentanyl crisis. But the intention of the newest wave of tariffs is to renegotiate existing trade agreements and make trade fair for American companies. It is important to understand that the use of tariffs is not an uncommon part of global trade. In fact, according to the World Trade Organization over 170 countries around the globe currently impose tariffs.3 Bermuda, the Solomon Islands and Cayman Islands are the countries with the top weighted average tariff rates (29.5%, 20.7% and 20.4% respectively).4

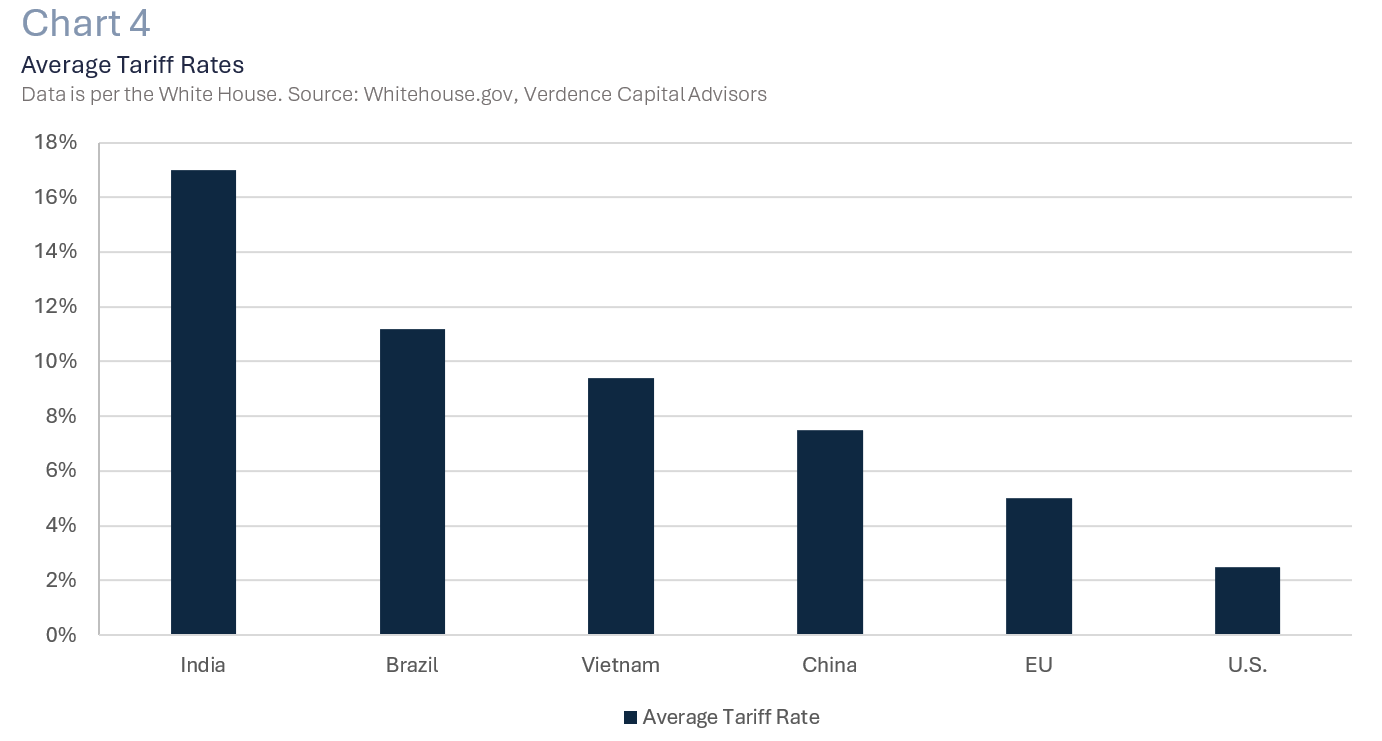
Prior to “Liberation Day,” the U.S. charged a relatively low average tariff rate compared to many other major export countries (Chart 4). This is because we have always been an advocate for free global trade. However, over the years many countries have taken advantage of that. And it is making it difficult for American companies to compete in global trade and raising several risks to our country. Some of the risks and unfair trade practices include:


Chart of the average tariff rates


  • Uneven tariff rates: The foundation of global trade was built on reciprocity. However, there are many examples of U.S. products that are sold to other countries. Those companies pay a much higher tariff than the U.S. charges them. For example, U.S. dairy companies face tariffs of 200-300% to sell their products to Canada (after certain quotas are met).5 Harley Davidson motorcycles face over 30% tariffs when sold in the European Union.6 The EU imposes a 10% tariff on U.S. cars sold in their markets, compared to a 2.5% rate imposed by the U.S. on European cars.7
  • Financial security at risk: By purchasing goods from foreign countries, the U.S. is sending dollars overseas. Those countries typically buy U.S. Treasuries with that money. This has allowed the U.S. to fund a massive budget deficit by issuing more Treasuries. For example, China and Japan are the two largest foreign holders of U.S. Treasuries. Combined, they hold 5% of the outstanding Treasury securities. If foreign owners decide to slow or sell U.S. Treasuries that would have a direct impact on interest rates in the U.S.
  • Intellectual property theft/technology transfer: There are several instances where U.S. companies (especially in technology, aerospace, semiconductors, healthcare) that do business in a foreign country (mainly China). They are required to share technology which has led to the stealing of American intellectual property and puts U.S. innovation at risk.
  • Dumping: Dumping is an example of an unfair trade policy. It’s where a foreign country sells goods abroad at a price that is below what it costs them to produce it and lower than what they sell it for in their own country. This puts U.S. companies at a competitive disadvantage.
  • Subsidies/Tax Breaks: Foreign countries offer subsidies and tax breaks to their domestic producers. This is so they can sell their products internationally more cheaply. While this is allowed under the World Trade Organization rules, it has damaged U.S. corporations’ global competitiveness.
  • Domestic security: We are relying on foreign countries to produce critical necessities. For example, the U.S. imported $246 billion worth of medicinal, dental and pharmaceutical products in 2024. We also imported $649 billion worth of non-agricultural industrial supplies and materials including nuclear fuel, metals and chemicals. We witnessed what the lack of domestic production means in times of crisis. We scrambled for medicine and supplies during the COVID pandemic.

It is important to understand that the use of tariffs is not an uncommon part of global trade.

Verdence View

We understand that even the mention of tariffs is a highly contentious topic. In this white paper, we wanted to educate why the world is talking about tariffs, trade deficits and why we are igniting a trade war with some of our greatest allies. The U.S. is the world’s largest consumer and countries have been using that to their advantage for decades. There has been widespread abuse and even cheating to circumvent the World Trade Organization’s rules and regulations on global trade. Many politicians regardless of their political affiliation can agree on the disadvantages U.S. companies face in global trade, few politicians have the will to tackle the problem.

We do not know what the result will be as negotiations are actively taking place, but we believe that tariffs in some form or fashion are here to stay. We do know that President Trump is a negotiator. He has campaigned on that in the past and even showed us his negotiating style in his first term. He comes out hard and fast with the intention to meet somewhere in the middle. We also know that because we are the world’s largest consumer other countries need us to support their own economies. China has a massive trade surplus with the U.S. which shows how important it is for trade to continue (Chart 5).

Chart of Surplus with the U.S.

We think discussions will proceed country by country and concessions will be made on both sides of the table. We also think this will be resolved in the coming months as President Trump has a much bigger campaign promise to satisfy with the extension of the Tax Cuts and Jobs Act that expires at the end of this year. That does not mean it will not come with short term pain.

We have seen that in the financial markets and could see temporary disruptions from a supply chain perspective and a slowdown in growth if not a short and shallow recession. It may also temporarily impact inflation and keep the Federal Reserve in a difficult position on flexibility with interest rates. However, we are looking at dislocations in the market due to the volatility around the constant headlines as buying opportunities. We do not see this as a long-drawn-out disruption. Countries around the world are too intertwined and dependent upon each other to not see some agreements made sooner than later.

Lastly, it is important to remember that our economy is resilient, and U.S. companies are highly innovative and resourceful; we will get through this, and we may even see added benefits when we get to the other side. We have already seen major companies, U.S. and international, commit to considerable investments in the U.S. which can have long term benefits for the U.S. economy. We will continue to monitor the situation and focus on our long-term investment philosophy and take advantage of dislocations when the price is reflecting near-term risks.

If you have any questions or comments, please reach out to your financial advisor.

Disclaimer: © Verdence Capital Advisors, LLC

Reproduction without permission is not permitted. The indexes presented are unmanaged portfolios of specified securities and do not reflect any initial or ongoing expenses nor can it be invested in directly. An investment’s portfolio may differ significantly from the securities in the index.  This material was prepared by Verdence Capital Advisors, LLC (“VCA” or “we”, “our”, “us”). VCA believes the information and data in this document were obtained from sources considered reliable and correct and cannot guarantee either their accuracy or completeness. VCA has not independently verified third-party sourced information and data. Any projections, outlooks or assumptions should not be construed to be indicative of the actual events which will occur. These projections, market outlooks or estimates are subject to change without notice. This material is being provided for informational purposes only and is not intended to provide, and should not be relied upon for, investment, accounting, legal, or tax advice. Past performance is not a guarantee of future results. Different types of investments involve varying degrees of risk, and there can be no assurance that the future performance of any specific investment, investment strategy, or product or any non-investment related content, made reference to directly or indirectly in these materials will be profitable, equal any corresponding indicated historical performance level(s), be suitable for your portfolio or individual situation, or prove successful. You should not assume that any discussion or information contained in this report serves as the receipt of, or as a substitute for, personalized investment advice from VCA. Alternative investments are designed only for sophisticated investors who are able to bear the risk of the loss of their entire investment. Investing in alternative investments should be viewed as illiquid and generally not readily marketable or transferable. Investors should be prepared to bear the financial risks of investing in an alternative investment for an indefinite period of time. Due to various factors, including changing market conditions and/or applicable laws, the content may no longer be reflective of current opinions or positions. All indexes are unmanaged, and you cannot invest directly in an index. Index returns do not include fees or expenses. Sector Watch Use of this website is intended for U.S. residents only. Any recommendation, opinion or advice regarding securities or markets contained in such material does not reflect the views of Verdence Capital, and Verdence Capital does not verify any information included in such material. Verdence Capital assumes no responsibility for any fact, recommendation, opinion, or advice contained in any such research material and expressly disclaims any responsibility for any decisions or for the suitability of any security or transaction based on it. Any decisions you may make to buy, sell, or hold a security based on this research will be entirely your own and not in any way deemed to be endorsed or influenced by or attributed to Verdence Capital. It is understood that, without exception, any order based on such research that is placed for execution is and will be treated as an UNRECOMMENDED AND UNSOLICITED ORDER. Further, Verdence Capital assumes no responsibility for the accuracy, completeness, or timeliness of any such research or for updating such research, which is subject to change without notice at any time. Verdence Capital does not provide tax, or legal advice. Under no circumstance is the information contained within this research to be used or considered as an offer to sell or a solicitation of an offer to buy any particular investment/security. Fixed income securities are subject to increased loss of principal during periods of rising interest rates. Fixed income investments are subject to various other risks including changes in credit quality, market valuations, liquidity, prepayments, early redemption, corporate events, tax ramifications and other factors. Lower rated securities are subject to greater credit risk, default risk, and liquidity risk. Commodity‐related products, including futures, carry a high level of risk and are not suitable for all investors. Commodity‐related products may be extremely volatile, illiquid and can be significantly affected by underlying commodity prices, world events, import controls, worldwide competition, government regulations, and economic conditions, regardless of the length of time shares are held. Data is provided for information purposes only and is not intended for trading purposes. Verdence Capital shall not be liable for any errors or delay in the content, or for any action taken in reliance on any content. Weekly Insights/Qtrly & Annual Outlook The indexes presented are unmanaged portfolios of specified securities and do not reflect any initial or ongoing expenses nor can it be invested in directly. An investment’s portfolio may differ significantly from the securities in the index. Semi-Annual Chart Pack Where shown, performance information presented is that which has been calculated and presented by an unaffiliated third-party manager. We have no insight into the performance of the advisor/product/account or fund shown and do not attempt to determine whether the performance presented is accurate. Therefore, the performance could be incorrect, overstated or not reflective of actual trading of client funds. There is the potential that the performance shown is a back test and not the result of real investment advice and trading. As such, it could not be relied upon as indicative of future returns of a particular strategy. Where performance shown is that of a pooled account, limited partnership, or private equity fund, you should be aware that there is a significant lack of transparency into the operations and investment process and investment vehicles invested in. As a result, pricing and valuation of the underlying holdings which produced the stated performance could be incorrect, stale, or overstated and therefore the performance figures presented cannot be relied upon. Before investing, we encourage you to request additional information, particularly performance information, of any product that you are considering for your client. You should read, as applicable, the Prospectus, SAI, Composite Disclosure and/or performance disclosure associated with any product that you are considering for investment for your or your client’s. Products shown may have minimum account sizes or minimum investments which may preclude retail and non-high net worth investors from being able to invest in these products. You should be aware that certain LPs may be closed to new investors and therefore your clients may be prevented from investing in these products. Portfolio Implementation and Rationales The SMA Asset Allocation Models do not represent a personalized recommendation of a particular investment strategy to you or your clients. You should not buy or sell an investment without first considering whether it is appropriate for your client’s portfolio. Additionally, you should review and consider any recent market news. All expressions of opinion are subject to change without notice in reaction to shifting market conditions. Data contained herein from third-party providers is obtained from what are considered reliable sources. However, its accuracy, completeness or reliability cannot be guaranteed. Supporting documentation for any claims or statistical information is available upon request. Examples provided are for illustrative purposes only and not intended to be reflective of results you can expect to achieve. Diversification and asset allocation do not ensure a profit and do not protect against losses in declining markets. Any forecasts contained herein are for illustrative purposes only, may be based upon proprietary research and are developed through analysis of historical public data. Investments in growth stocks may experience price volatility due to their sensitivity to market fluctuations and dependence on future earnings expectations. Sector allocation references to market capitalization (“smid cap” or “micro caps” etc.) may be subject to special risks given their characteristic narrow markets, limited financial resources, and less liquid stocks, all of which may cause price volatility. International/global investing can involve special risks, such as political changes and currency fluctuations. These risks are heightened in emerging markets. A significant percentage of the underlying investments in aggressive asset allocation portfolio investments have a higher-than-average risk exposure. You should consider your risk tolerance of each of your clients carefully before choosing such a strategy. An investment with multiple underlying investments (which may include asset-allocation or custom blended investments) may be subject to the expenses of those underlying investments in addition to those of the investment itself. Investments may reside in the specialty category due to 1) allowable investment flexibility that precludes classification in standard asset categories and/or 2) investment concentration in a limited group of securities or industry sectors. Investments in this category may be more volatile than less flexible and/or less concentrated investments and may be appropriate as only a minor component in an investor’s overall portfolio. Investment Managers You and your clients should carefully consider investment objectives, risks, charges, and expenses of Funds discussed. This and other important information are contained in the respective Fund prospectuses and summary prospectuses, which should be read carefully before investing. Investment portfolio statistics change over time. Current performance may be lower or higher than return data quoted herein. The investment return and the principal value of an investment will fluctuate; so, an investor’s shares/units, when redeemed, may be worth more or less than their original cost. Verdence relies heavily on unaudited third-party data. Data sources include public data, such as mutual fund data, and non-public data, such as information provided by other investment advisors and managers of limited partnership pooled accounts. Data and/or statistics included on this Portal, including references to performance, opinions, ratings, rankings, manager statistics and demographic information, product, or strategy descriptions, either quantitative or qualitative, are based upon information reasonably available to us as of the applicable date(s) then-published. Information has been obtained from sources that we believe to be reliable, but these sources cannot be guaranteed as to their accuracy or completeness. All data and information produced by a third party has the potential to be incorrect, incomplete, or otherwise misleading. No implication shall be created that the information contained on the Site is correct, including as of any time subsequent to the publish date, and Verdence does not undertake an obligation to update such information at any time after such date. Verdence makes not warranty or representation of the veracity of the data and information and its use of the information should not be implied as an endorsement of any material or statements made. Data, particularly non-public data, is subject to error and where the information is not audited, the potential for error is greater. Where shown, performance information presented is that which has been calculated and presented by an unaffiliated third-party manager. We have no insight into the performance of the advisor/product/account or fund shown and do not attempt to determine whether the performance presented is accurate. Therefore, the performance could be incorrect, overstated or not reflective of actual trading of client funds. There is the potential that the performance shown is a back test and not the result of real investment advice and trading. As such, it could not be relied upon as indicative of future returns of a particular strategy. Where performance shown is that of a pooled account, limited partnership, or private equity fund, you should be aware that there is a significant lack of transparency into the operations and investment process and investment vehicles invested in. As a result, pricing and valuation of the underlying holdings which produced the stated performance could be incorrect, stale, or overstated and therefore the performance figures presented cannot be relied upon. Before investing, we encourage you to request additional information, particularly performance information, of any product that you are considering for your client. You should read, as applicable, the Prospectus, SAI, Composite Disclosure and/or performance disclosure associated with any product that you are considering for investment for your or your client’s. Certain products shown may have account minimums or minimum investment sizes that are unattainable for your clients and therefore they may not be eligible to invest in these products. Reference to registration with the Securities and Exchange Commission (“SEC”) does not imply that the SEC has endorsed or approved the qualifications of Verdence or its respective representatives to provide any advisory services described on the Site.

Read more