
Before we offer our insights into the year ahead, we wanted to recap what an impressive year 2023 turned out to be for the economy and investors. At the beginning of 2023, it was difficult to find an economist who was optimistic about the economy. Economists had forecast a paltry 0.3% economic growth for the full year and there was nearly a 70% chance that we would see a recession. As we reflect on the last year, it is hard to find a time in history when so many forecasters were so wrong. The strength in the labor market defied most expectations and consumers continued to spend despite many obstacles. As a result, the U.S. economy likely grew 2.0-2.5% in 2023. Global equity and bond markets celebrated the surprising economic developments and the idea that central banks are at or near the end of their tightening cycles as inflation steadily decelerated. The MSCI AC World Index rose more than 20% with every major equity region higher. The craze around artificial intelligence sent the NASDAQ Composite over 40% higher. The bond market delivered positive returns for the first time in three years and a 60% stock (MSCI AC World Index)/40% bond (Bloomberg Aggregate) portfolio posted its best performance since 2019.
As we look to 2024, we note that the opinion that the Fed will deliver the perfect soft landing for the economy has become widely consensus. We are cautious because consensus views are known to get crowded and misguided. We agree with most that the Fed is likely at the end of the tightening cycle, but we do not think a soft landing is a sure thing. Instead, we believe it will be a challenging year for growth (especially in the first half) with a recession still on the table and a volatile road ahead for investors. In addition, the consensus view may already be reflected in prices and the rally to close out 2023 may have been borrowing from returns for 2024. Regardless, we are optimistic equities can deliver upper single digit returns for the year. Below we breakdown our six themes for 2024 and outline our recommendations for investors.
Theme #1: A Soft Landing is Not a Sure Thing
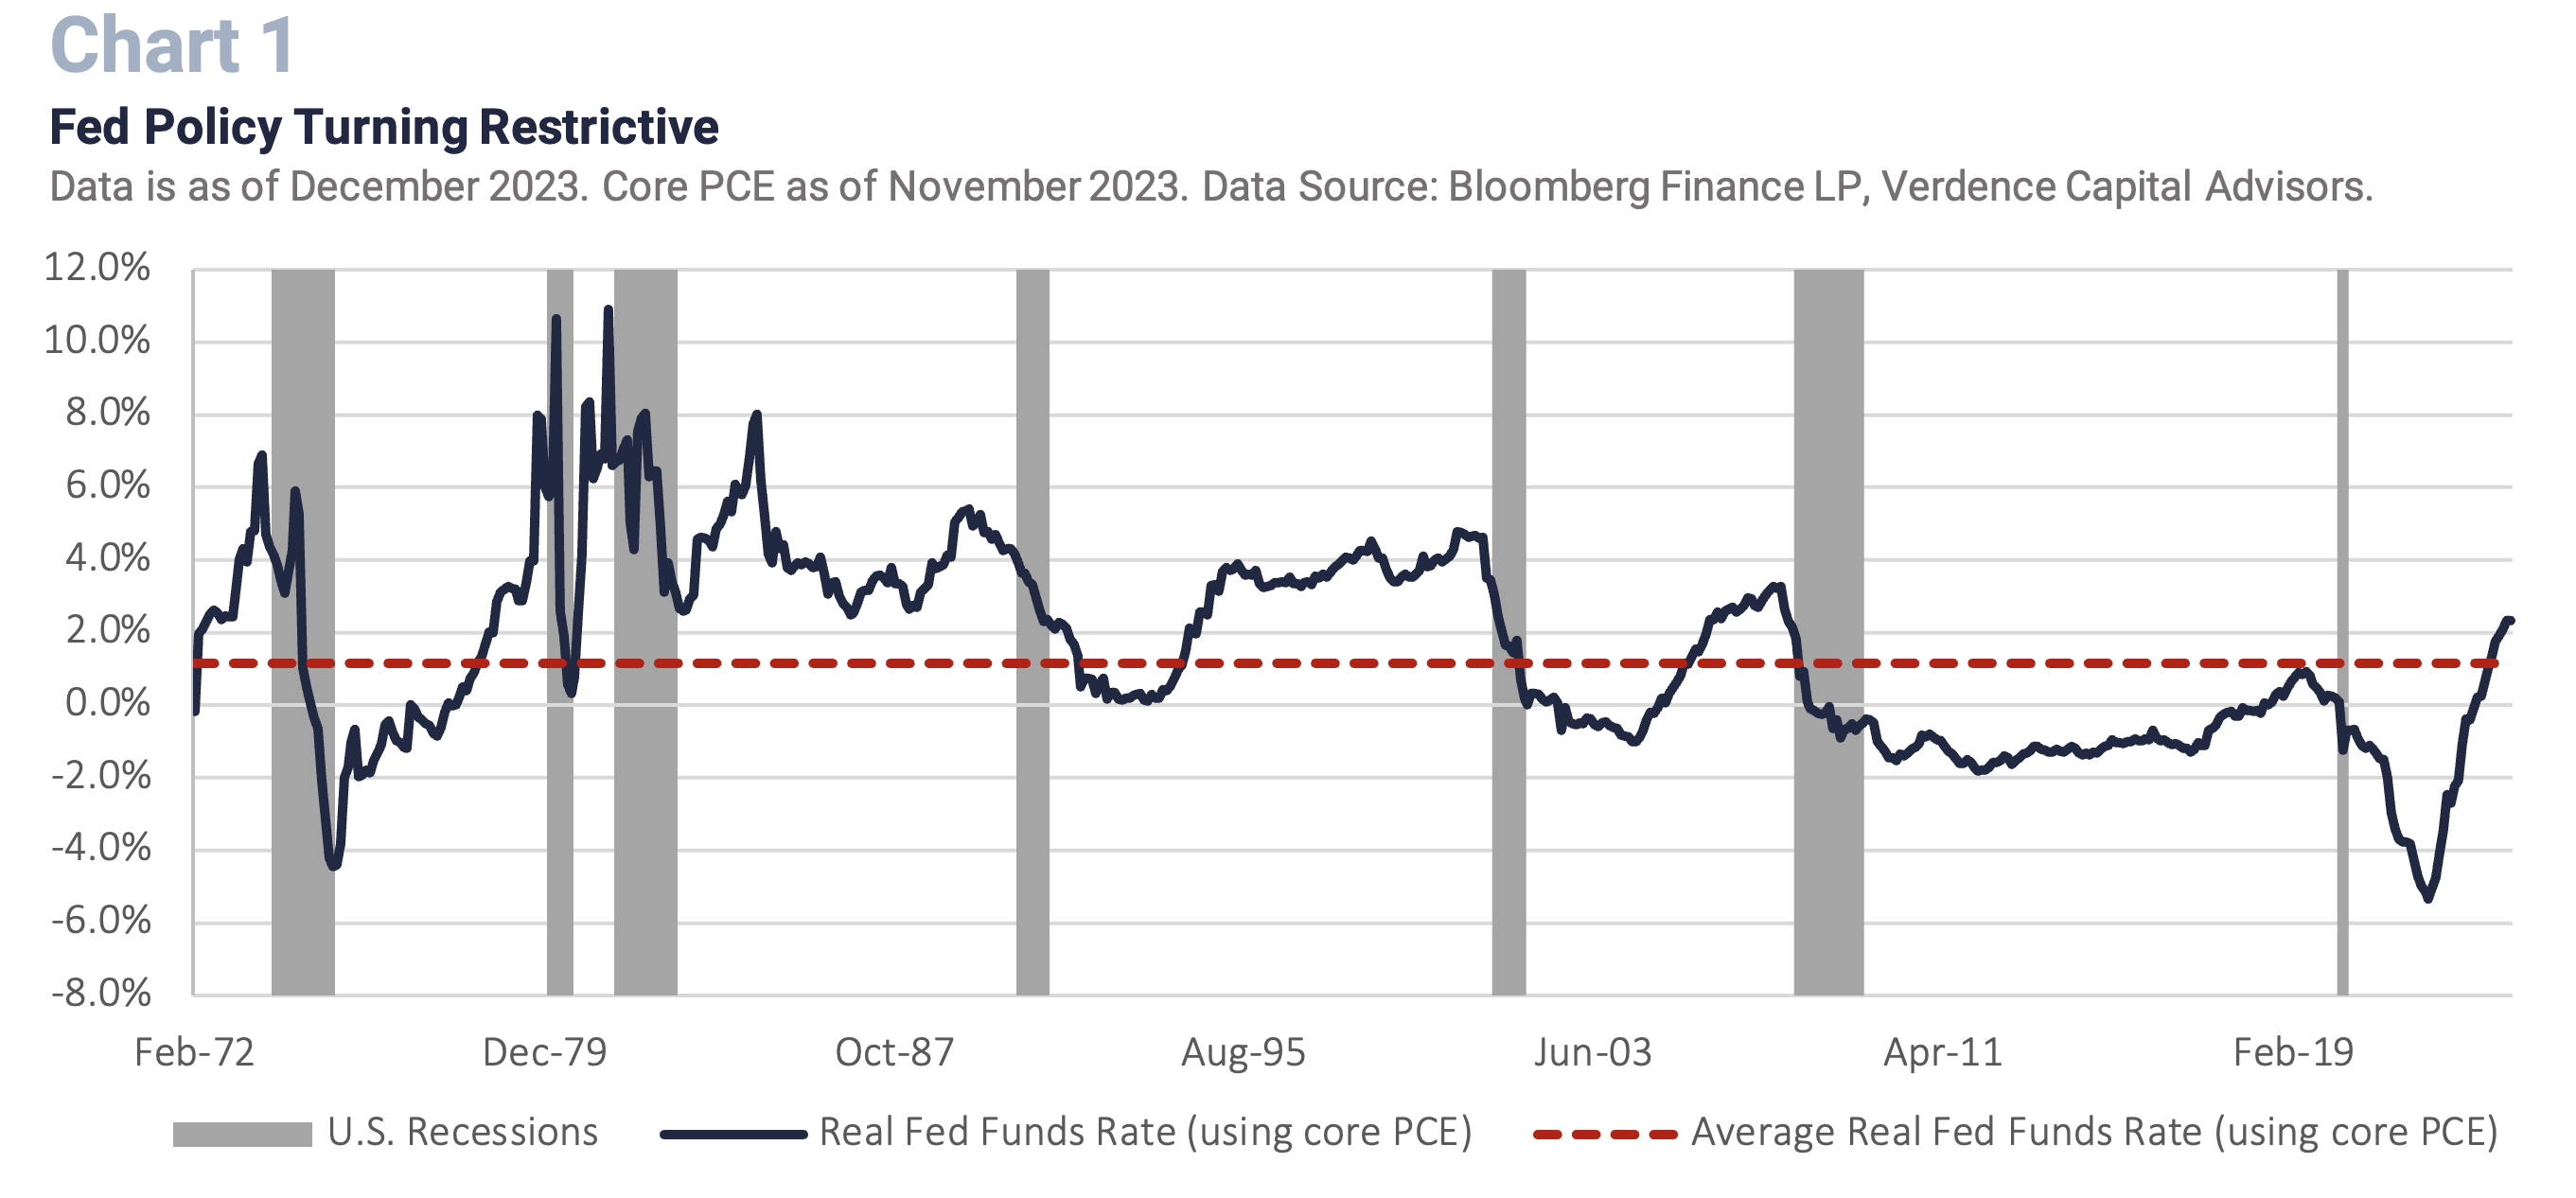
We are skeptical about the consensus view that a “soft landing” is a done deal. We see a greater probability that the economy will experience at least a short and shallow recession in 2024. Soft landings are rare in any historical economic cycle. Especially one that has experienced high inflation and an aggressive Fed tightening cycle. It is important to remember that monetary policy is felt with a lag, and it is likely that we have not felt the full effects of the Fed’s tight monetary policy or the tight lending conditions at banks due to the small and midcap banking crisis in early 2023. In fact, the real Fed funds rate has just recently turned positive, and as inflation continues to decelerate it should continue upward, further restricting economic growth until the Fed can justify cutting rates. (Chart 1).
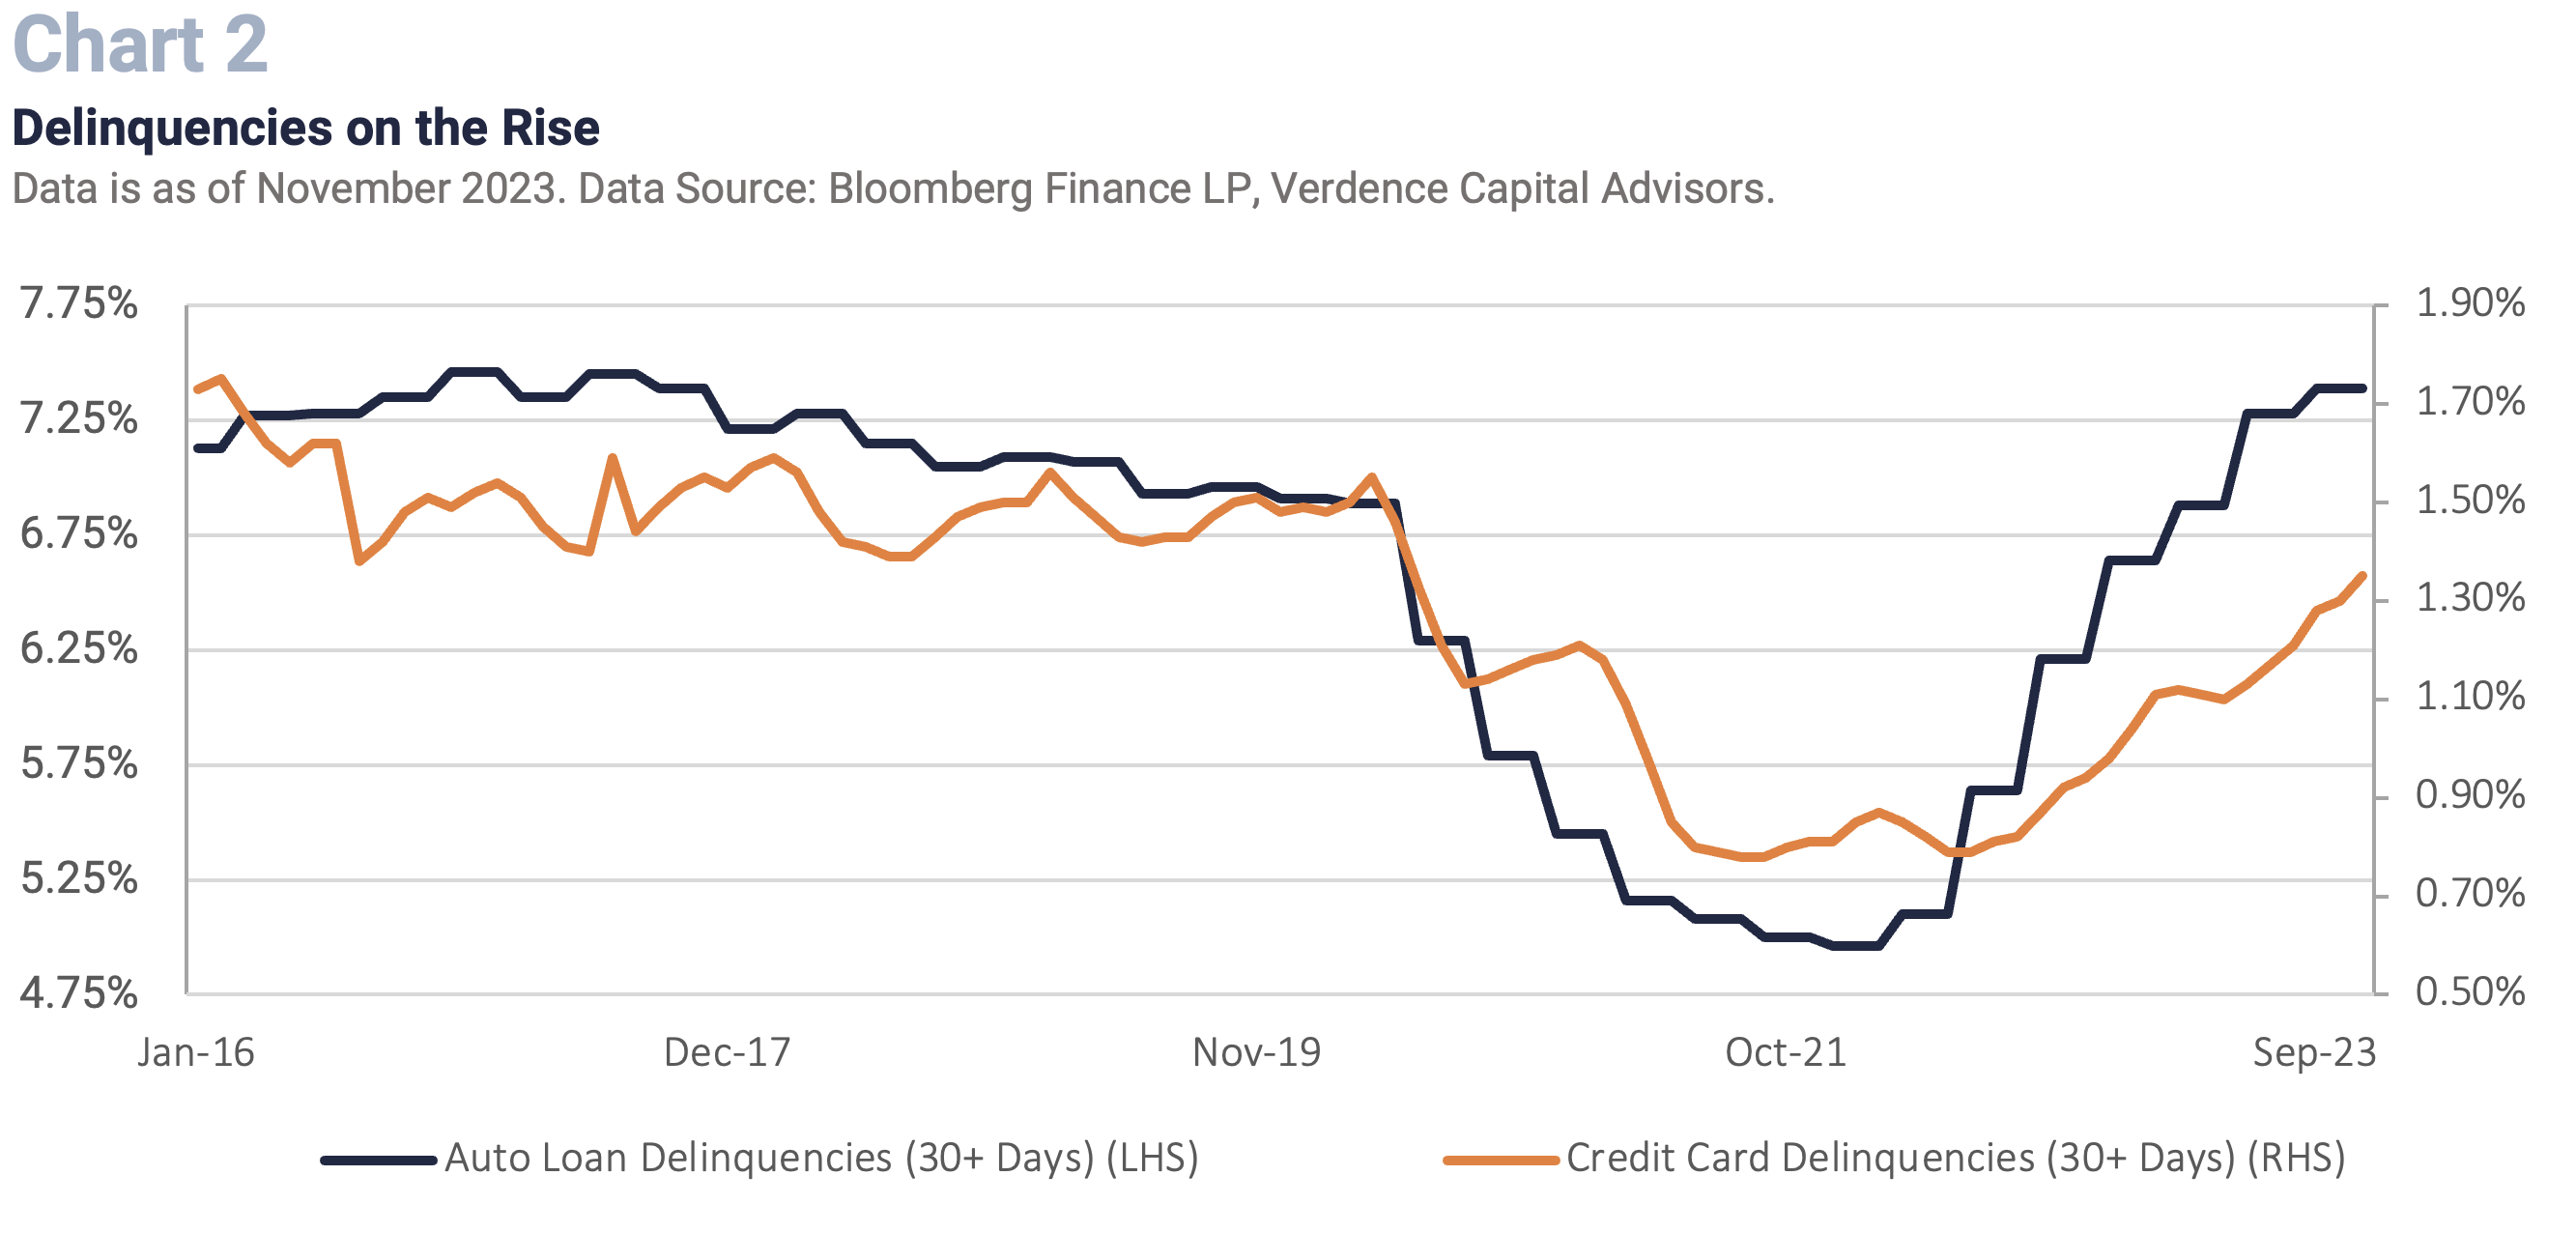
Outside of the Fed’s actions, nearly every facet of the economy except the labor market is in distress. Manufacturing has been contracting for 14 consecutive months, business optimism is mediocre at best, the housing market is paralyzed, and consumers are relying on credit card debt to fund spending with credit card rates near record highs. Now delinquencies in credit cards and auto loans are rising. (Chart 2). In addition, the Leading Economic Indicator Index, which has historically been a leading indicator for a recession, has been declining for 20 consecutive months. There has never been a time in history (records go back to 1959) when this index has declined for this many consecutive months and it did not coincide with a recession. Could this be a first? Possibly, but we are not convinced.
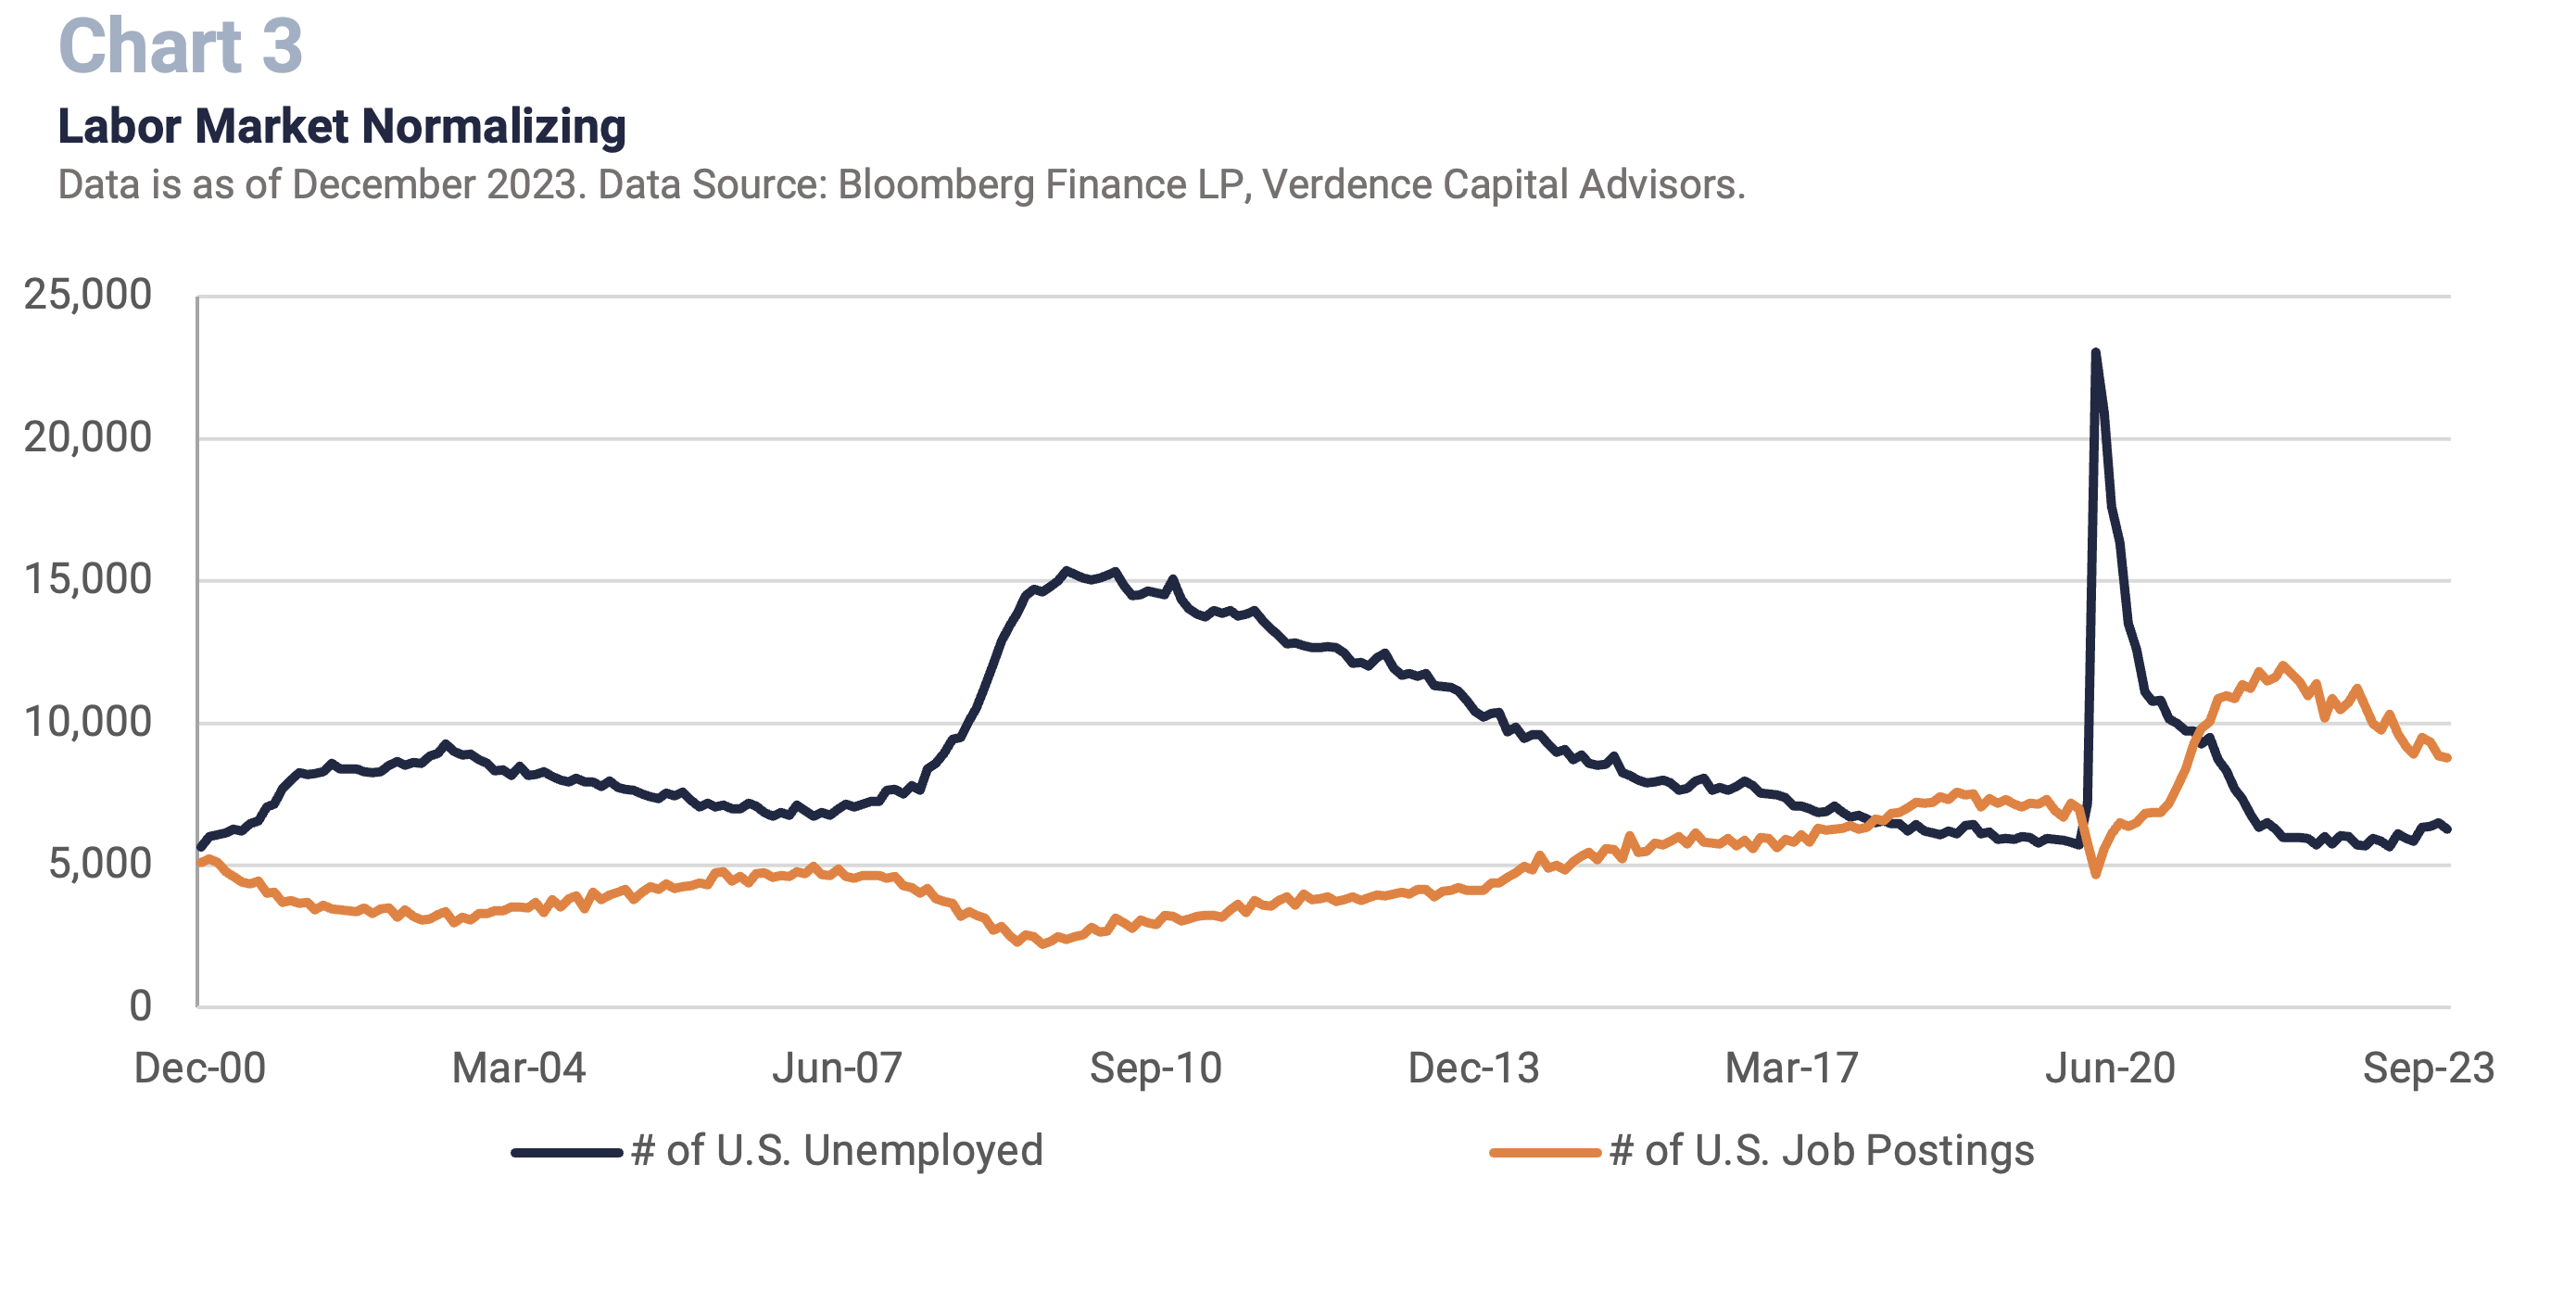
The labor market has been supporting growth and consumer spending. However, it is a general rule of thumb that the labor market is a lagging economic indicator. Employers are hesitant to lay off employees until the economy is clearly headed for a downturn. This economic cycle is even more unique because in the aftermath of the pandemic it was difficult for employers to find and retain workers. As a result, they may be taking even longer to let them go. However, we are starting to see cracks emerging in the labor market. Job postings have fallen for nine of the 11 months in 2023 for which we have data. At 8.8 million job postings, the number of postings compared to those unemployed is at the narrowest margin in over two years. (Chart 3). Other indicators like the decline in temporary workers, a moderating workweek and declining manufacturing and service employment are all signs of weakness for the labor market.
The resiliency in the economy has defied all expectations including our own. However, we do not see a path where at least a modest recession is avoidable. There are too many indicators that have historically been red flags for a recession that are flashing (e.g. inverted yield curve, leading indicators, manufacturing). Recessions can be scary to investors, but they are also necessary to bring inflation into balance with our country’s economic potential in the long run. We are still clearing out the excesses of the massive fiscal stimulus in the aftermath of the pandemic and this will take time to normalize all facets of the economy. Unfortunately, that will likely take a pullback in economic growth to fully even out.
Recessions can be scary to investors, but they are also necessary to bring inflation into balance with our country’s economic potential in the long run.
Theme #2 – Fed Walking a Fine Line: Reflation Risk is High
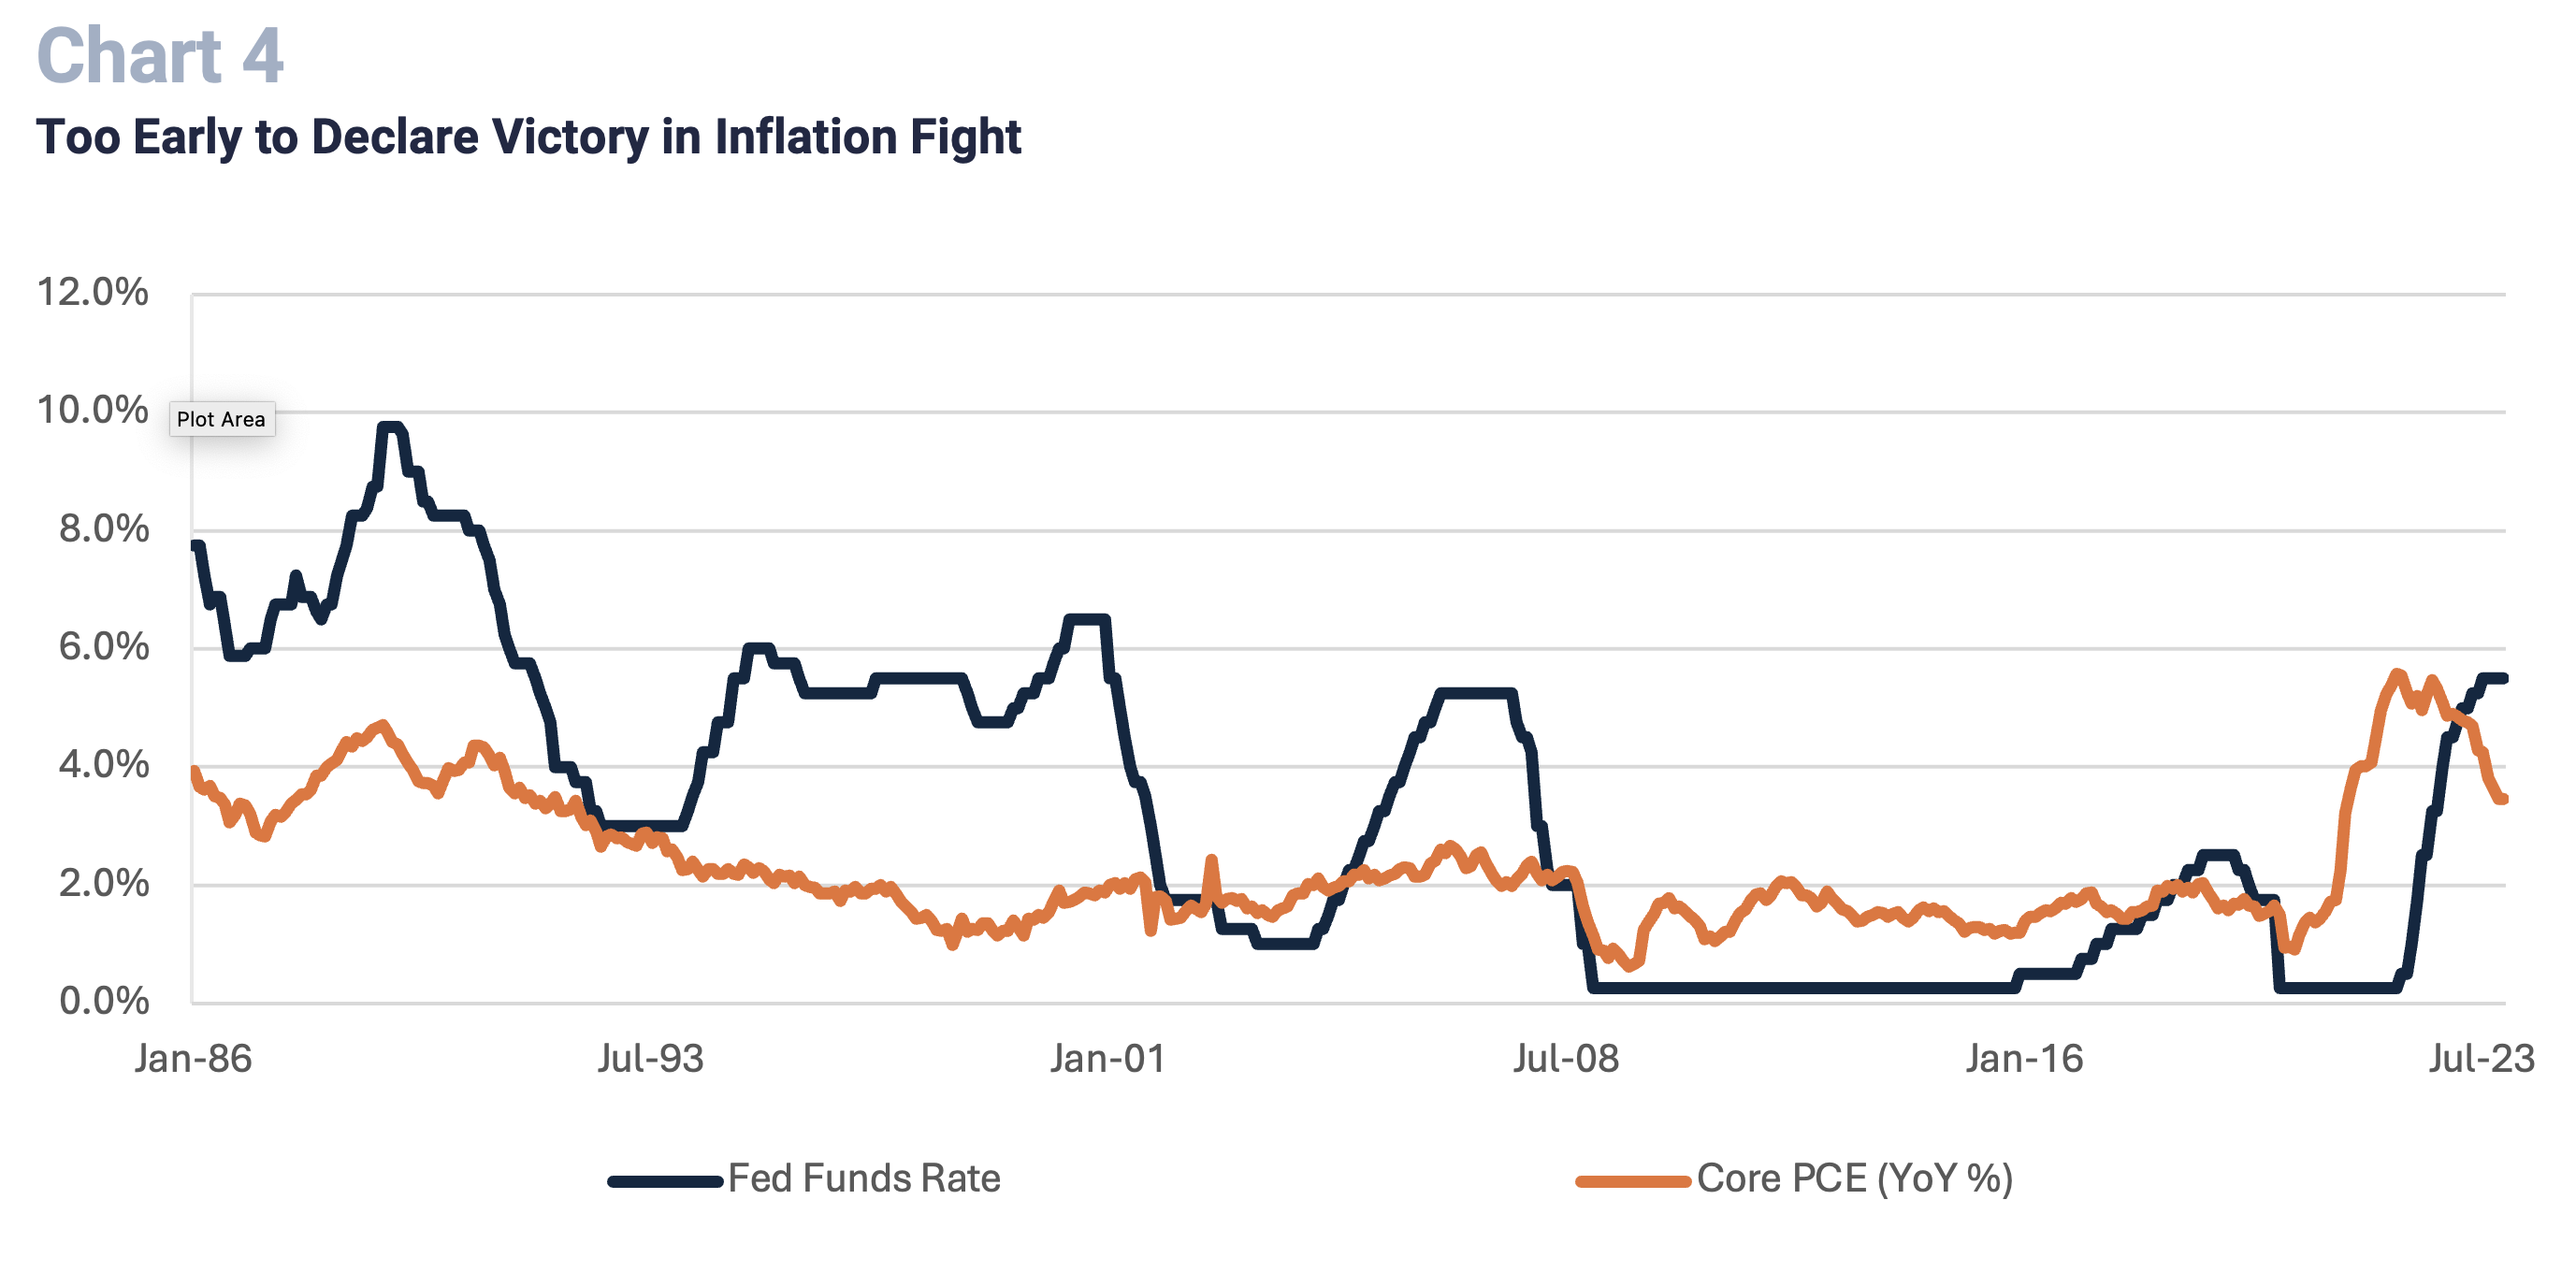
Inflation has finally been in a downward trajectory which is welcome news to consumers and the Fed. However, we believe reading too much into the Fed’s most recent “pivot” where they suggested rate cuts are on the horizon is misguided. In fact, we are apprehensive because this Federal Reserve has not proven to have the best track record at fighting inflation. The last Fed “pivot” was in early 2022 when they admitted inflation was not transitory and aggressive rate hikes were vital since they were behind the curve. Now we are concerned they may be turning too dovish too soon. Getting from 9% year over year inflation (Consumer Price Index in June 2022) to the current ~3% level has been a function of the supply chain normalizing as well as Fed rate hikes. However, to get down to the Fed’s 2.0% target at the core level (Core PCE Index is 3.5% YoY) and remain there is where the hard work begins. (Chart 4). Unfortunately, we do not see this happening until growth substantially slows with a likely recession. Sticky inflation from wage pressures, service pricing and housing are historically difficult to tackle.
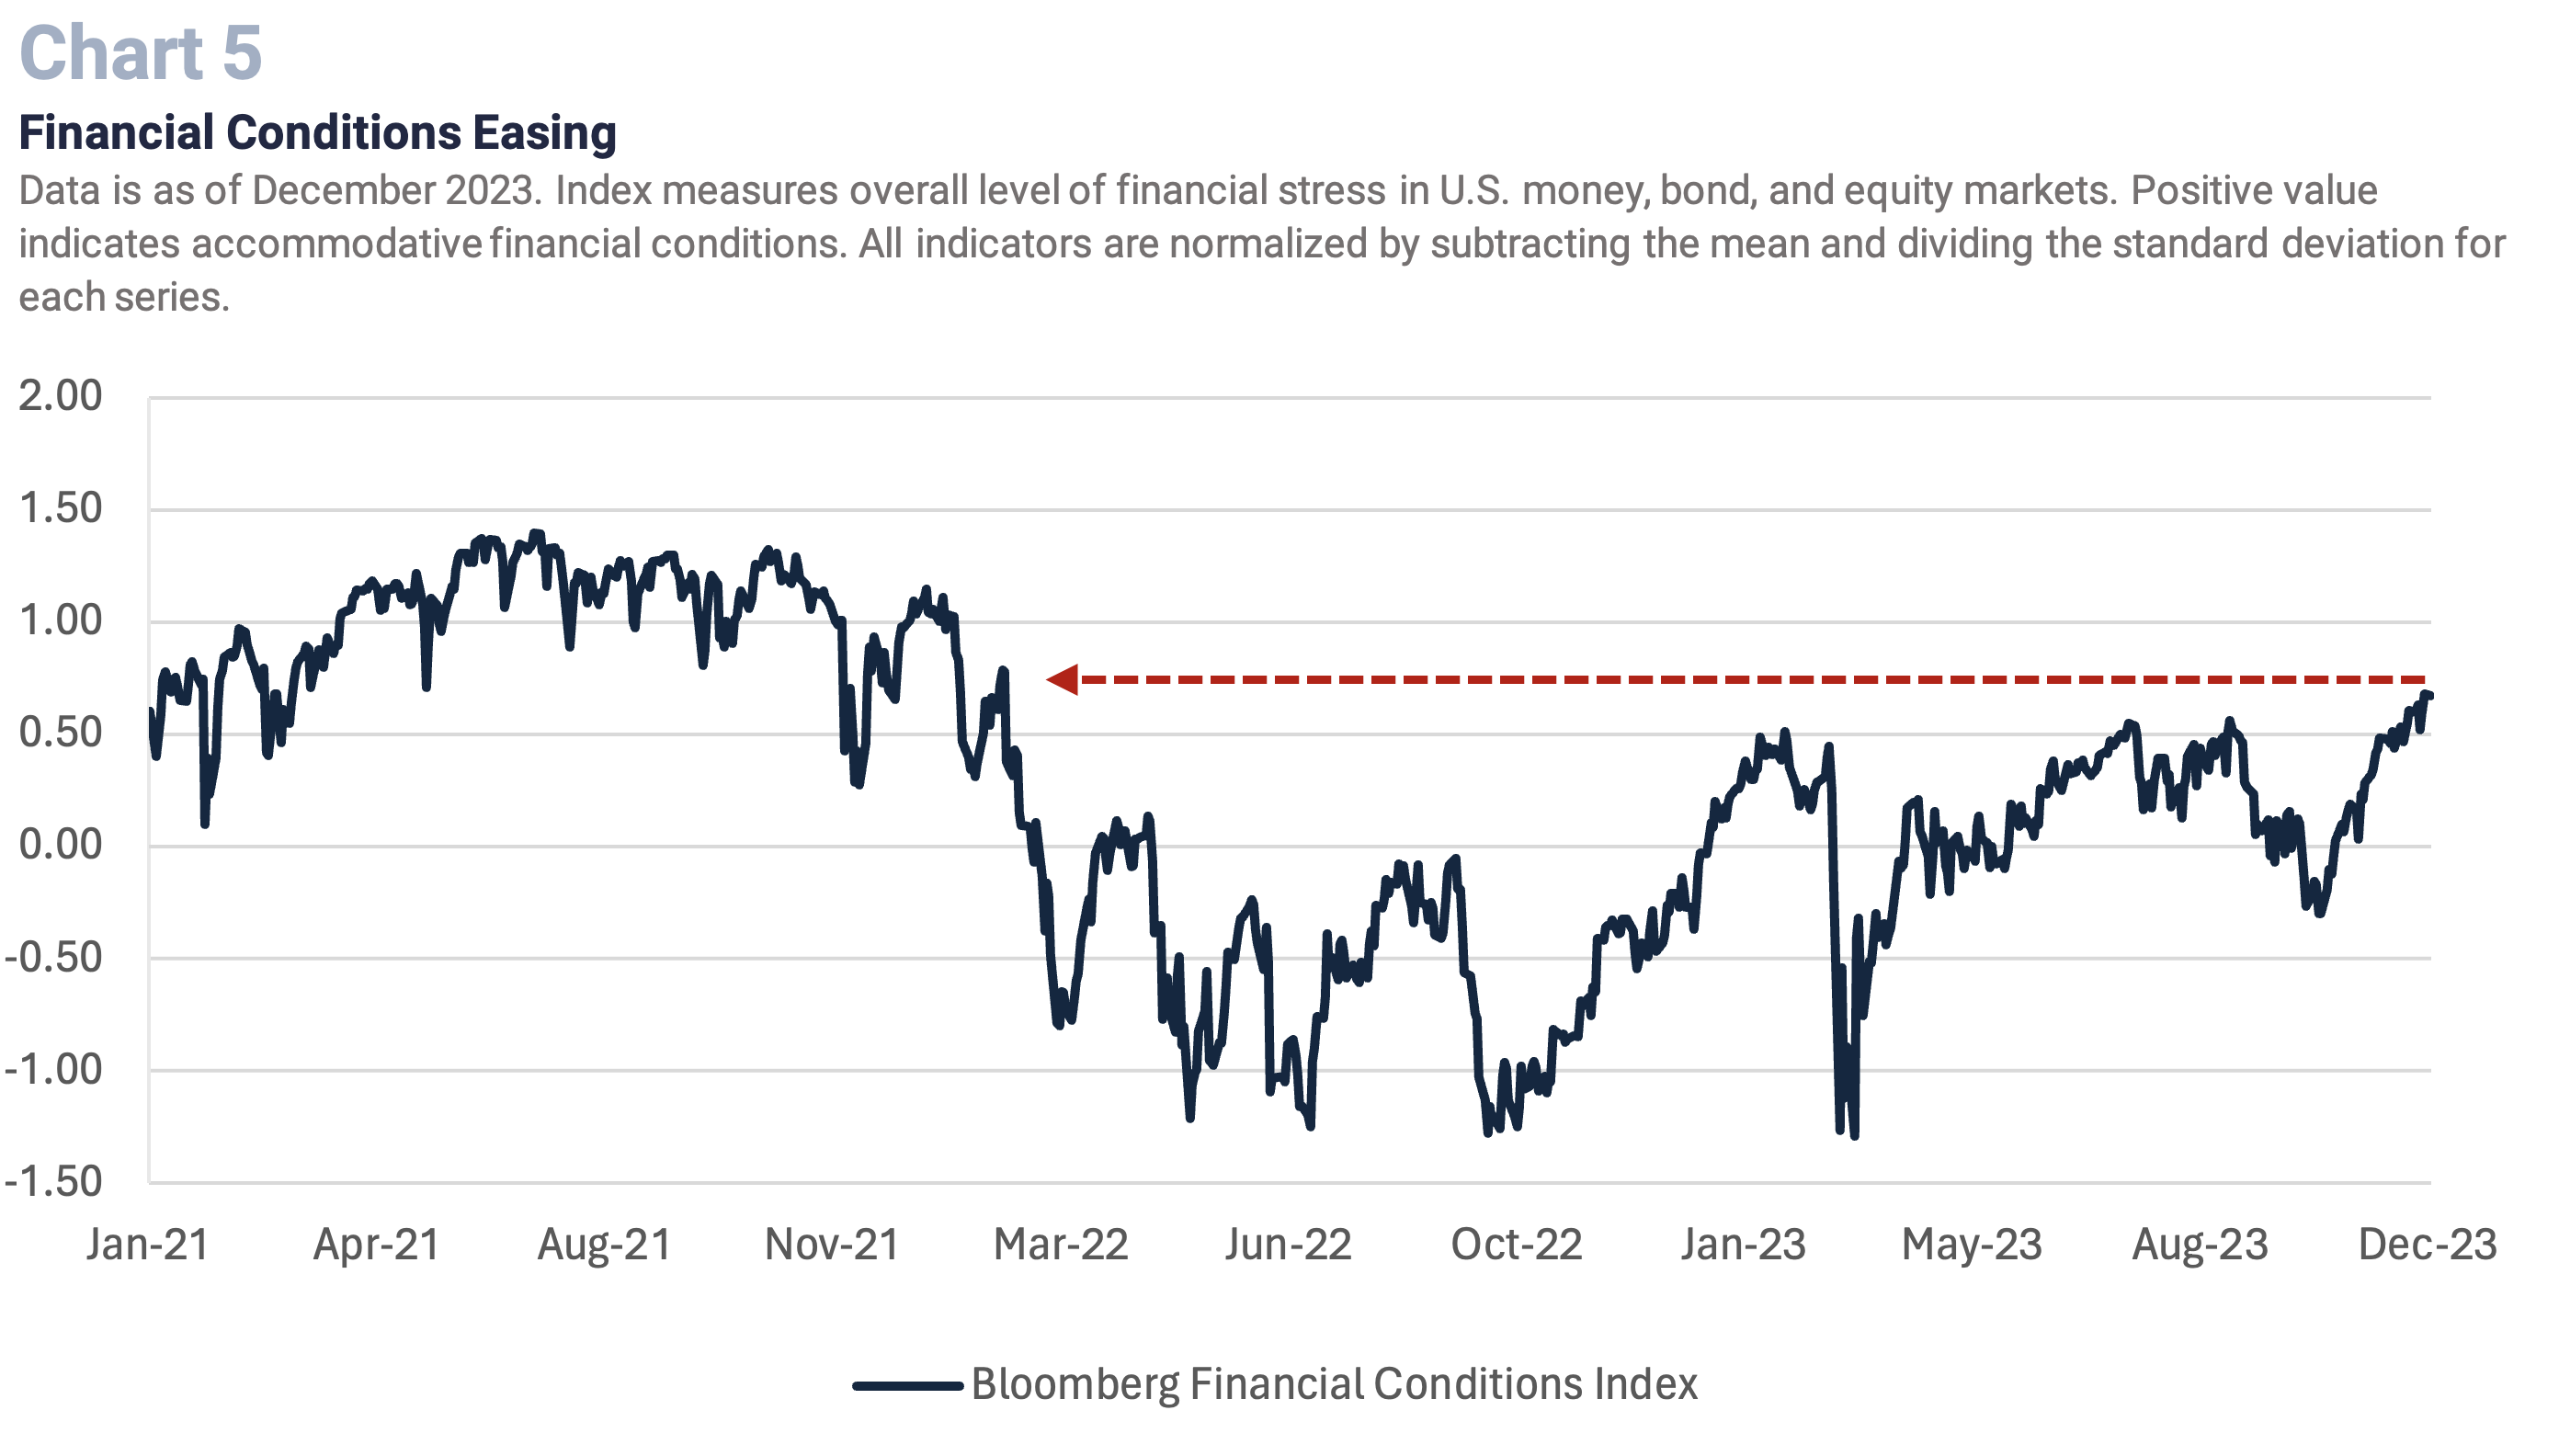
In addition, by suggesting rate cuts are on the horizon, asset price inflation is accelerating through the rally in equities and bonds. This could inadvertently lead to better consumer confidence and result in more spending which creates a vicious inflation circle. In fact, when looking at the Bloomberg Financial Conditions Index which measures volatility in a variety of indicators in the money, bond, and equity markets to decipher if financial conditions are easy or tight, the Index has eased the most since prior to the start of the Fed’s aggressive tightening cycle in early 2022. (Chart 5 ). If this persists it could unravel all the hard work the Fed has done. The Fed has made it clear they do not want to repeat the errors made during the 1970s/1980s with stop and go monetary policy. Instead, we think the Fed will ultimately err on the side of caution and remain on hold through most of 2024 with rate cuts in 2H24 at the earliest. The pace and exact timing of any rate cuts will be highly dependent on how harsh the economic downturn becomes.
Theme #3 – Austerity Rhetoric to Heat Up
We realize that cutting government spending in an election year is highly unlikely. However, as political debates heat up heading into the Presidential election, the burgeoning budget deficit is likely to be a major topic. The U.S. budget deficit is more than 6% of GDP and is expected to worsen over the next 10 years. This is nearly double what the deficit has historically been as a percent of GDP (~3% since late 1960s). To further understand how dire the budget situation is, there is no better place to look than at the astounding cost the government is paying to finance the deficit. Since interest rates have increased and debt issuance has surged, the net interest cost to fund the government debt has increased over 100% in the past five years. In fact, according to the Congressional Budget Office, it is estimated to surpass what we spend on our defense budget by 2029.
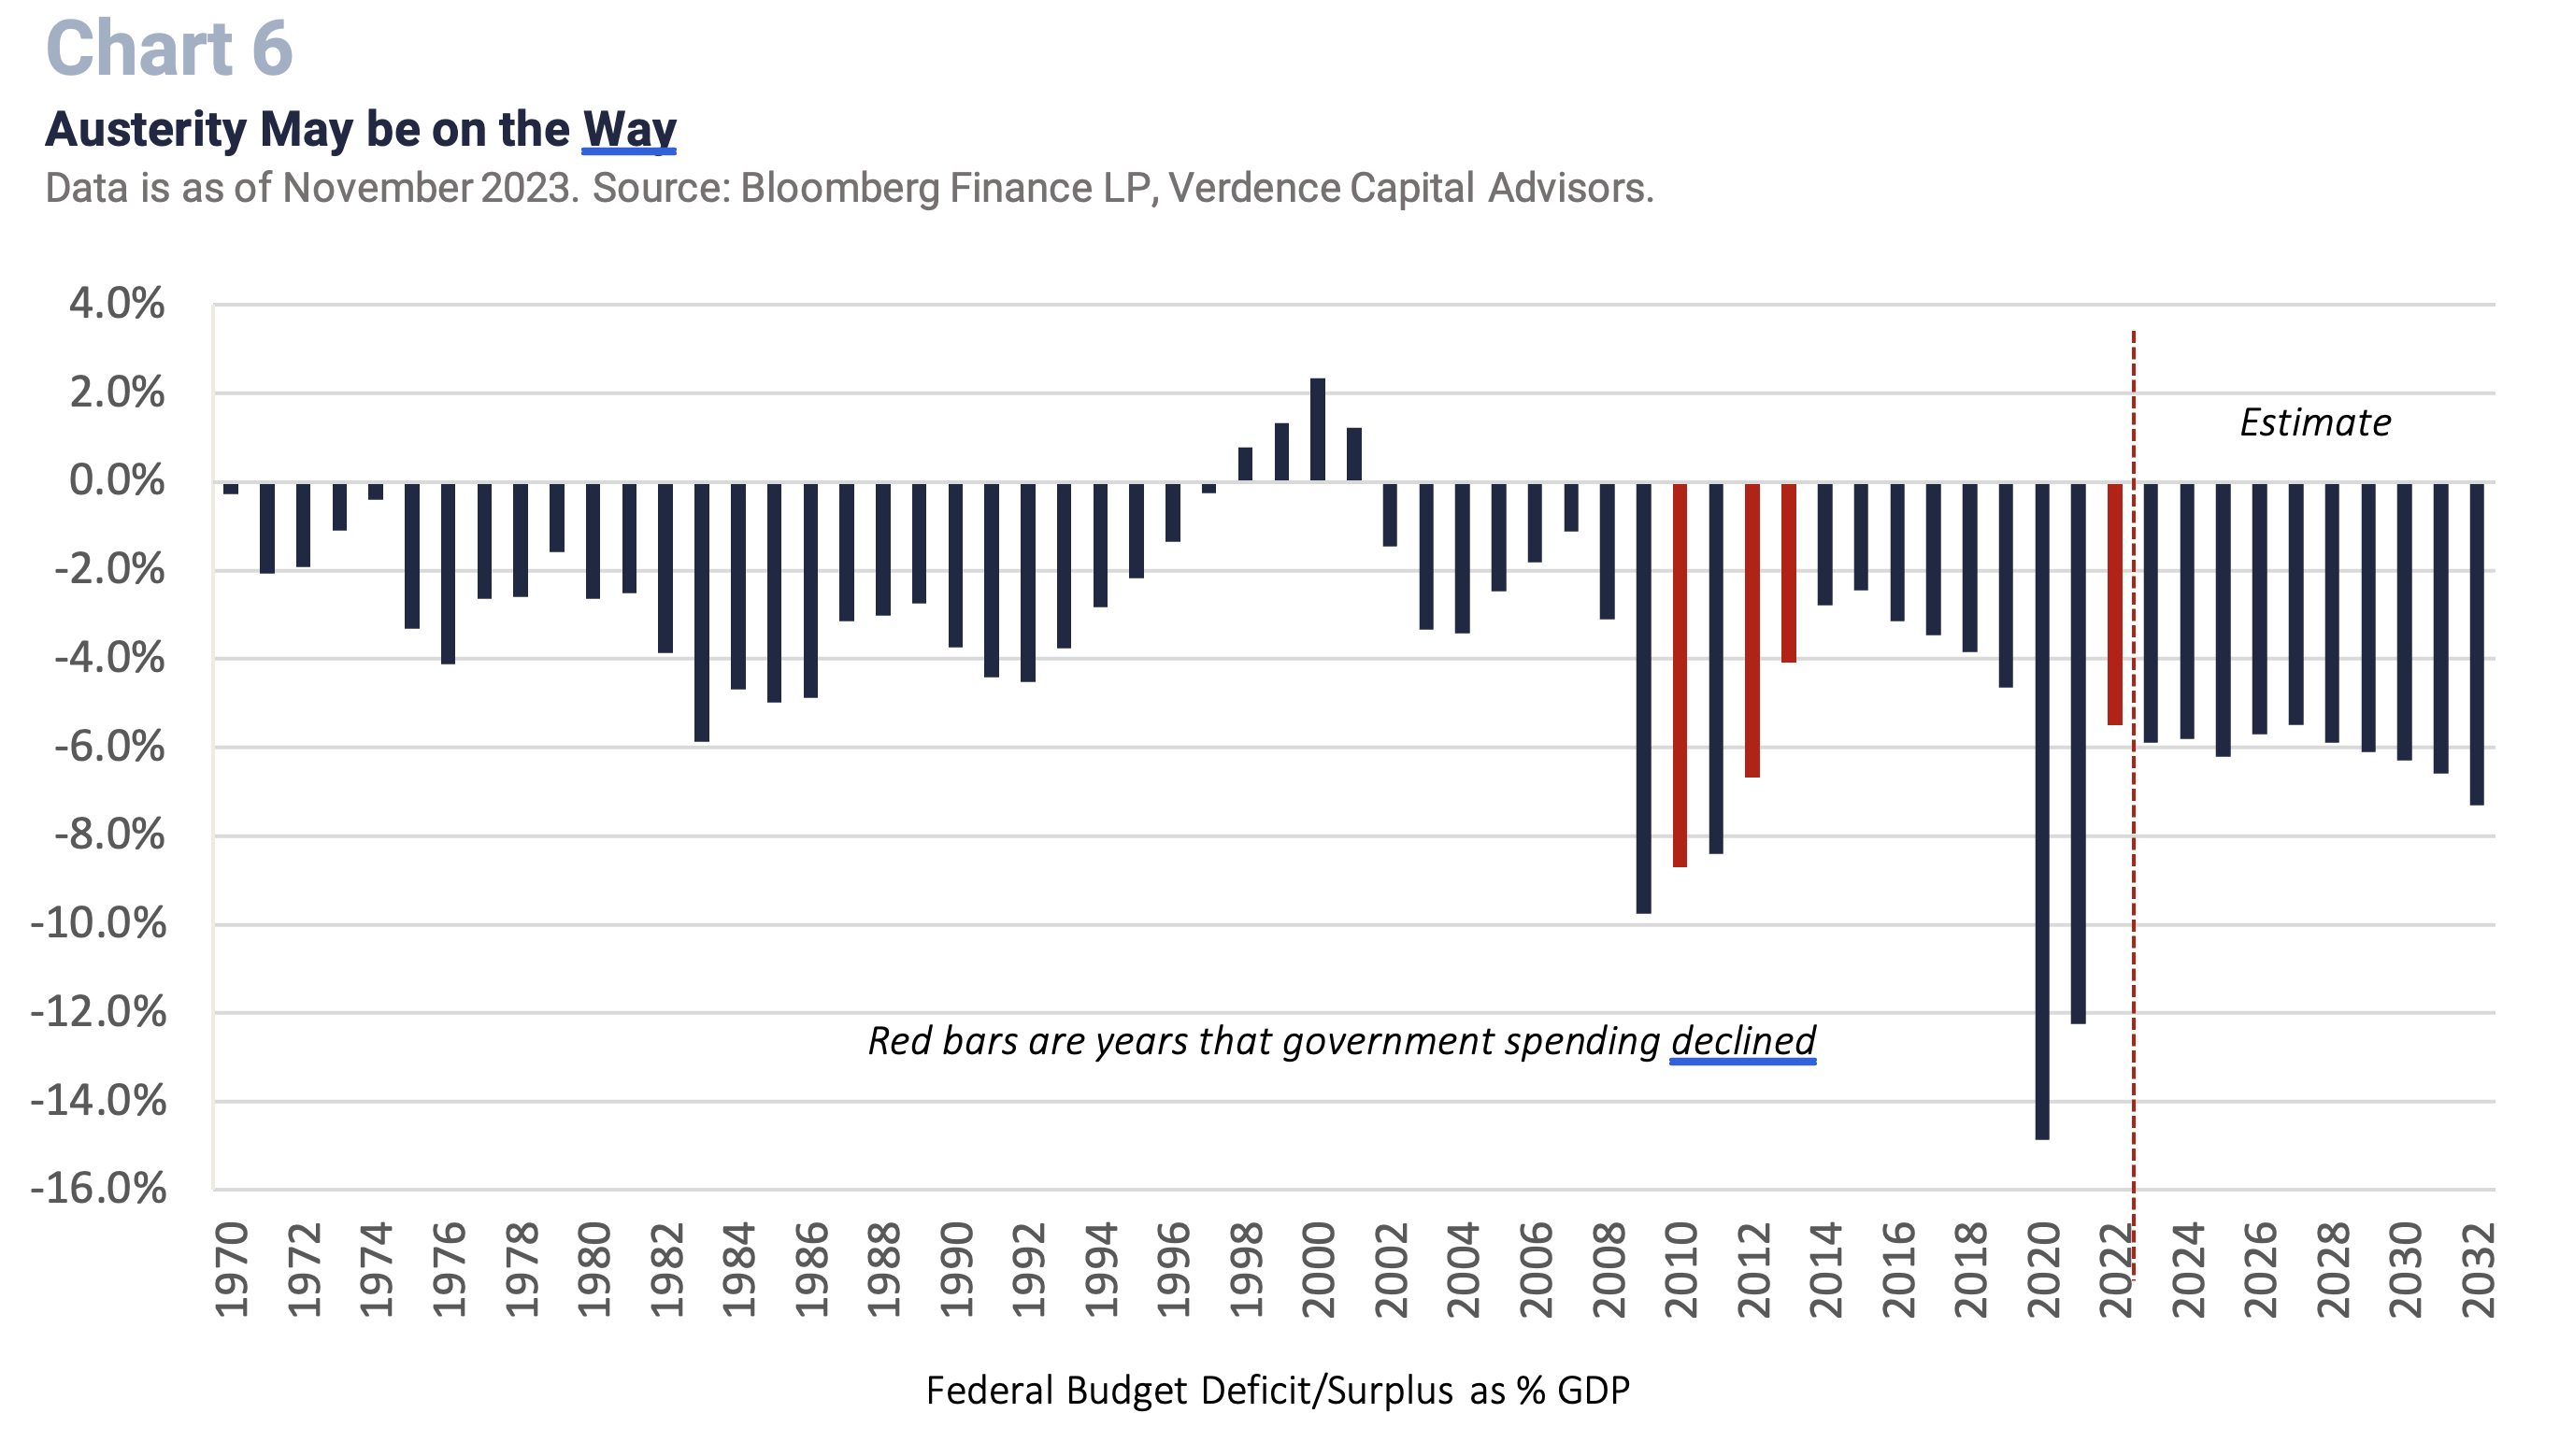
This is unsustainable and needs to be addressed. Unfortunately, getting the government to cut spending has not been historically successful. Going back to 1970, government spending has only declined four times on an annual basis (i.e., 2010, 2012, 2013, 2022). (Chart 6). All these observations resulted after a major event where fiscal stimulus was crucial at the time (i.e. Great Financial Crisis and COVID). Then spending needed to be pulled back as stimulus was no longer needed. In an election year with the deficit a major topic, the uncertainty about the government needing to cut programs in the coming years is likely to cause volatility in the markets. From an economic perspective, we may see companies put spending plans on hold until the new administration and its view on addressing the burgeoning deficit (e.g. tax hikes) become clear.
Theme #4 – Global Equities: Bar Set High
Global equities have defied expectations in 2023, despite a correction in U.S. markets in early 4Q23, a banking crisis, two wars, interest rates at multi-decade highs, and significant weakness in many international economies (e.g., Germany, United Kingdom, and Canada). However, with the MSCI AC World Index up more than 20% in 2023, we think we are borrowing from this year’s returns and pricing in a perfect economic, earnings and interest rate environment. While we remain optimistic about equities in the long term, we think that volatility will emerge as investors get more realistic about the current economic and interest rate uncertainty. While we think equities will finish the year positive, there will be better opportunities to increase equity exposure. At this time we recommend holding a neutral allocation against the strategic benchmark until valuations get more realistic. Some of the reasons we are being patient and holding our neutral allocation include:
- The forward price-to-earnings multiple of the MSCI AC World Index is trading at a 16% premium to its historical average. Paying a premium for equities in this highly uncertain economic climate is risky.
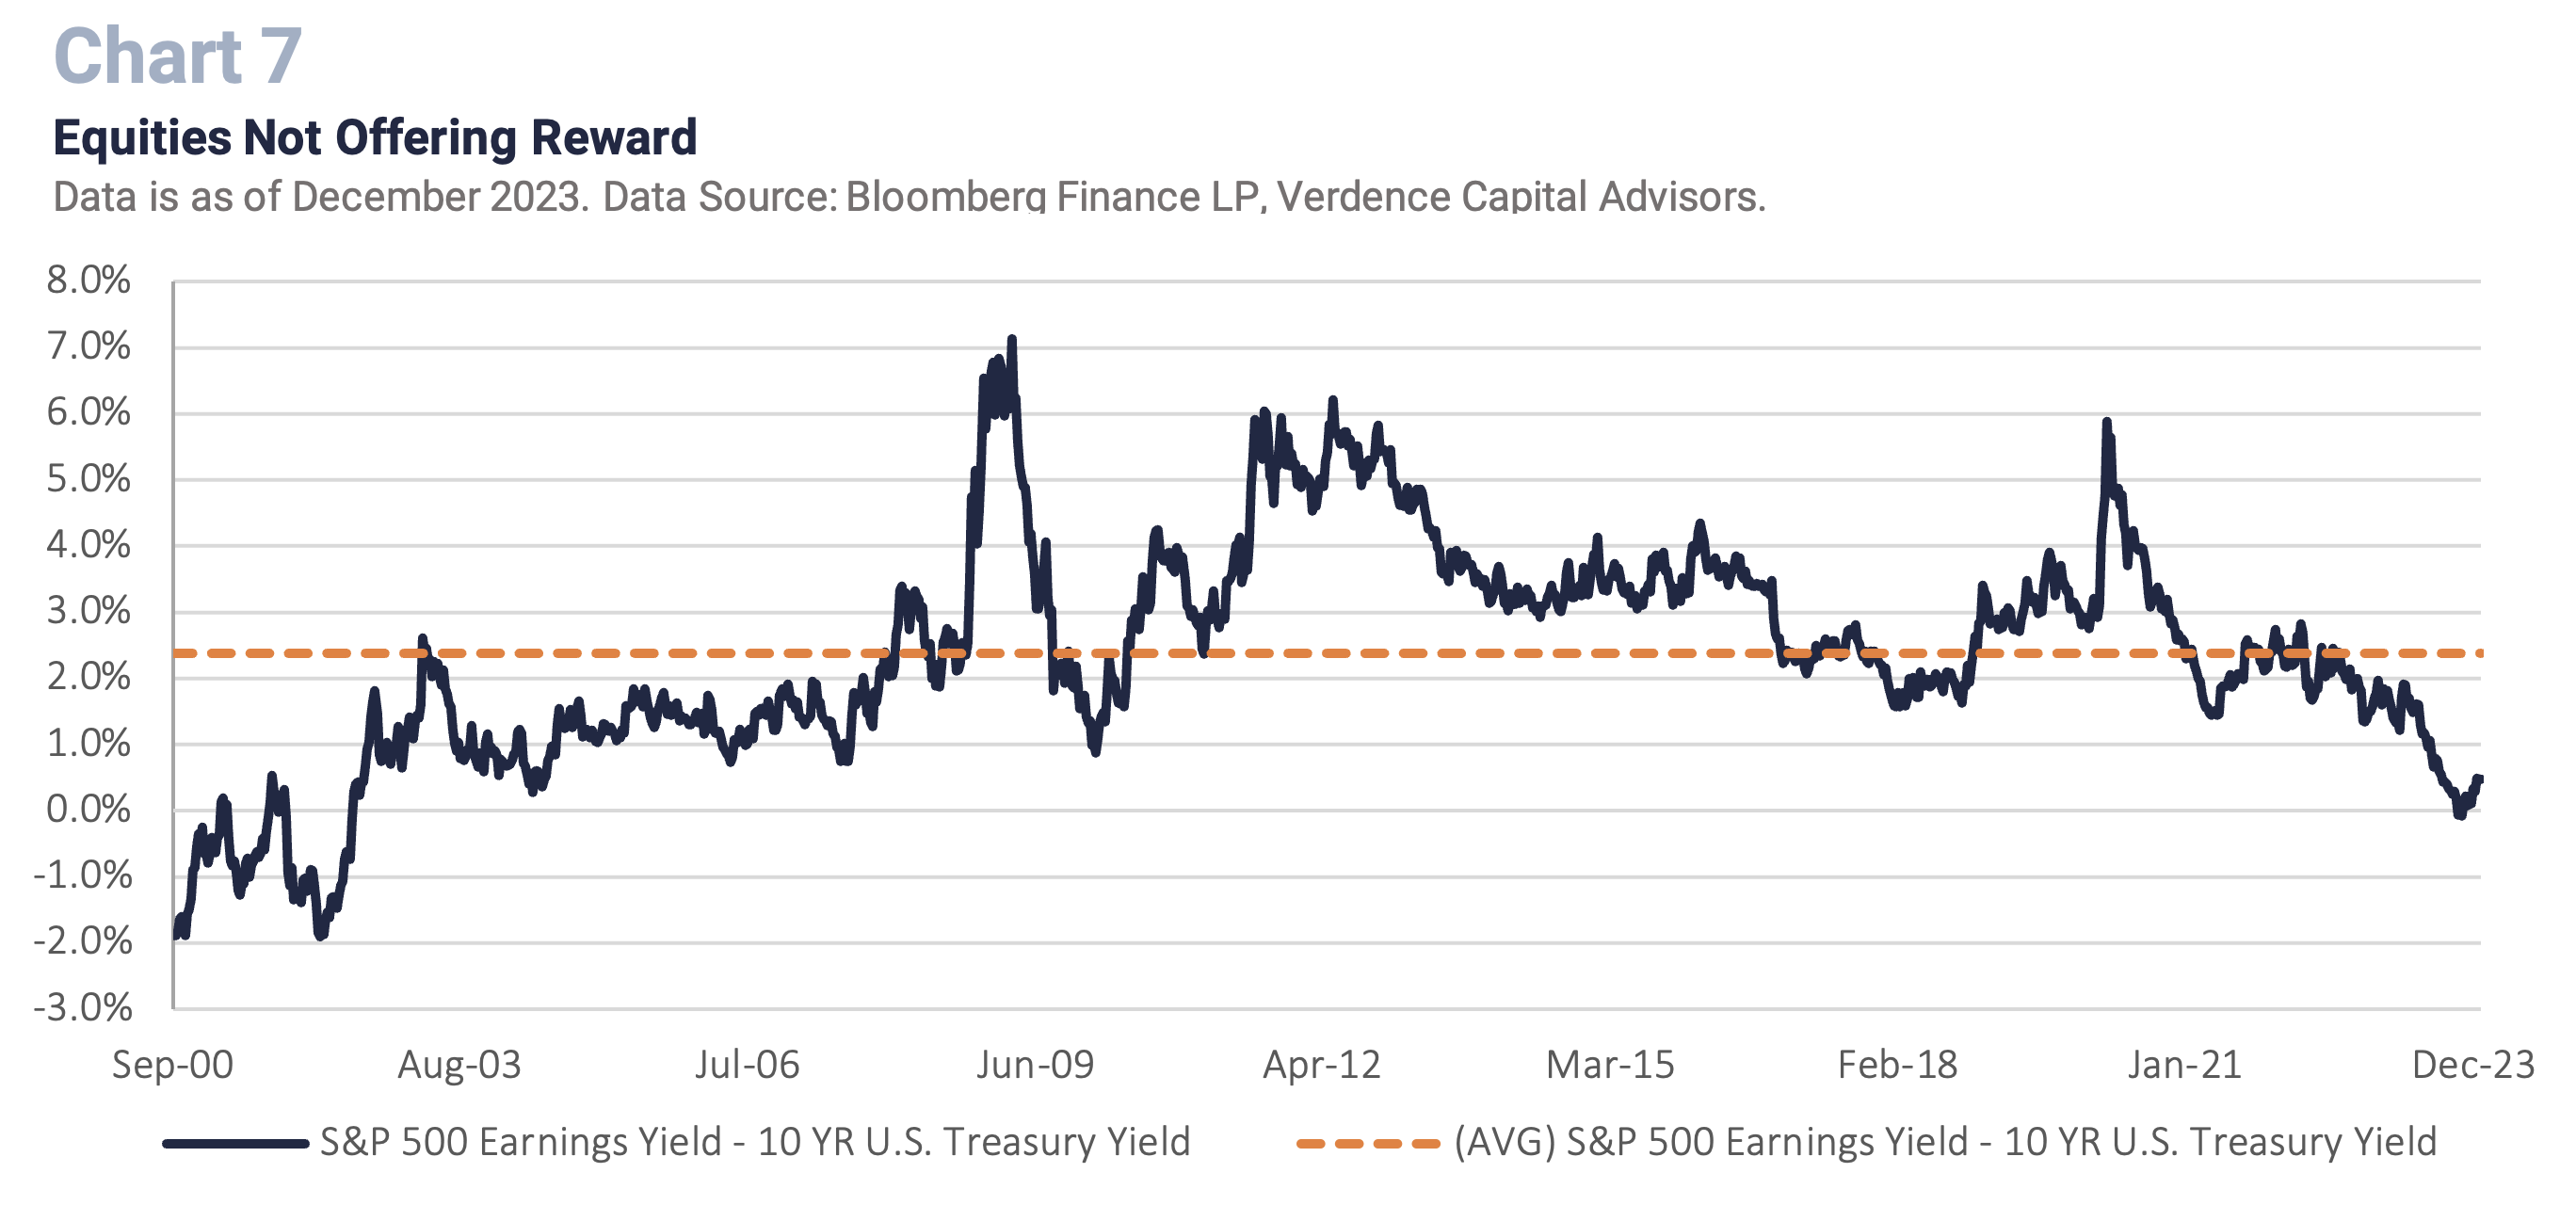
- The equity risk premium (i.e., premium equity investors should earn over risk-free rate of Treasuries) is near the lowest level since 2002 for U.S. equities (i.e., S&P 500). (Chart 7). This suggests investors may not be offered the same reward for taking on the risk of equities at these prices.
- History suggests that equities hit a rough period when the Fed goes on hold and before the first rate cut. Going back to 1953, the median average return for the S&P 500 has been negative in the three, six and 12 months after the Fed stops raising rates.
- Currently, earnings estimates may be overly optimistic. Analysts are expecting between 10-15% earnings growth in 2024 and 2025 for the S&P 500.
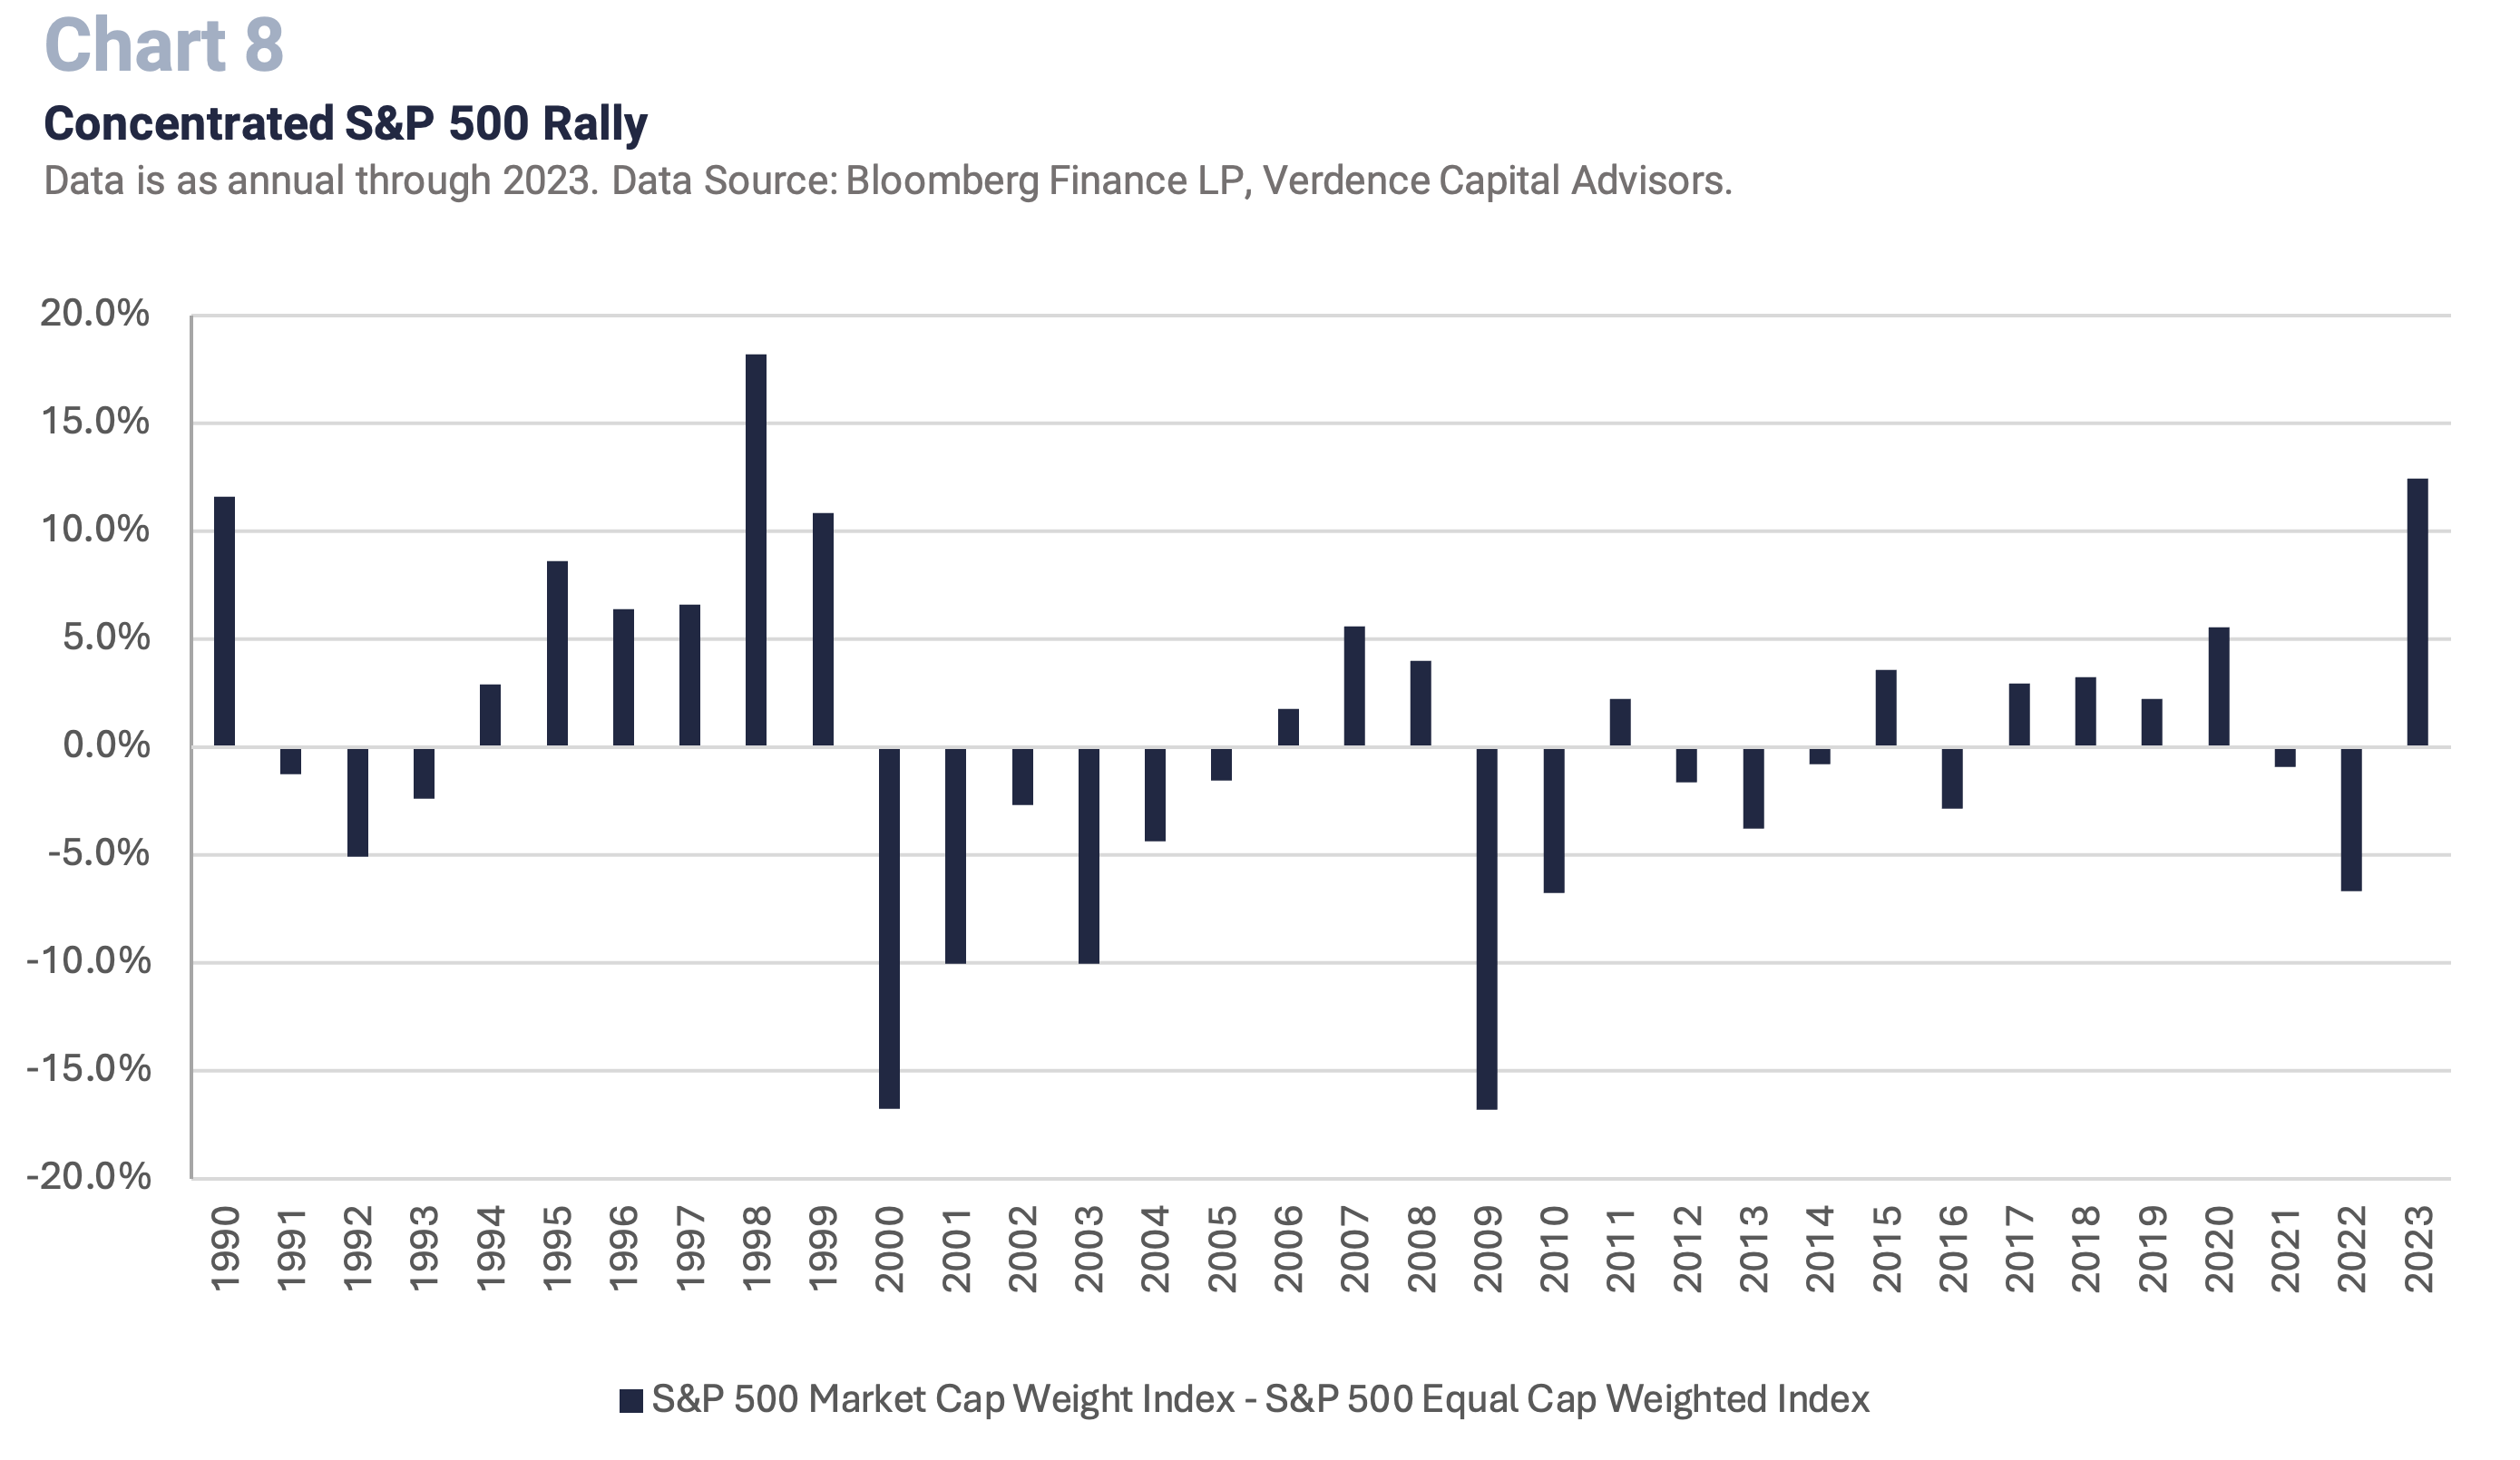
What we have discovered in 2023 is that not all equity markets are the same. In fact, within the U.S. the rally was highly concentrated in large cap growth stocks (especially technology) as the Russell 1000 Growth Index outperformed the Russell 1000 Value Index by 31%, the second largest outperformance on record (behind 2019). In addition, the S&P 500 market cap weighted index outperformed the S&P 500 equal weight index by over 10%, the most since 1998. (Chart 8). The “Magnificent 7” S&P 500 stocks (i.e., Apple, Amazon, Alphabet, NVIDIA, Tesla, Microsoft, and Meta) made up more than 60% of the total return of the S&P 500 in 2023. Those seven stocks were up, on average, 105% while the remaining 493 stocks were up 16%. We believe technology is a good long-term investment especially as the AI universe evolves. However, valuations look stretched given our view on interest rates and economic growth. We would wait for better entry points to add to large cap growth stocks.
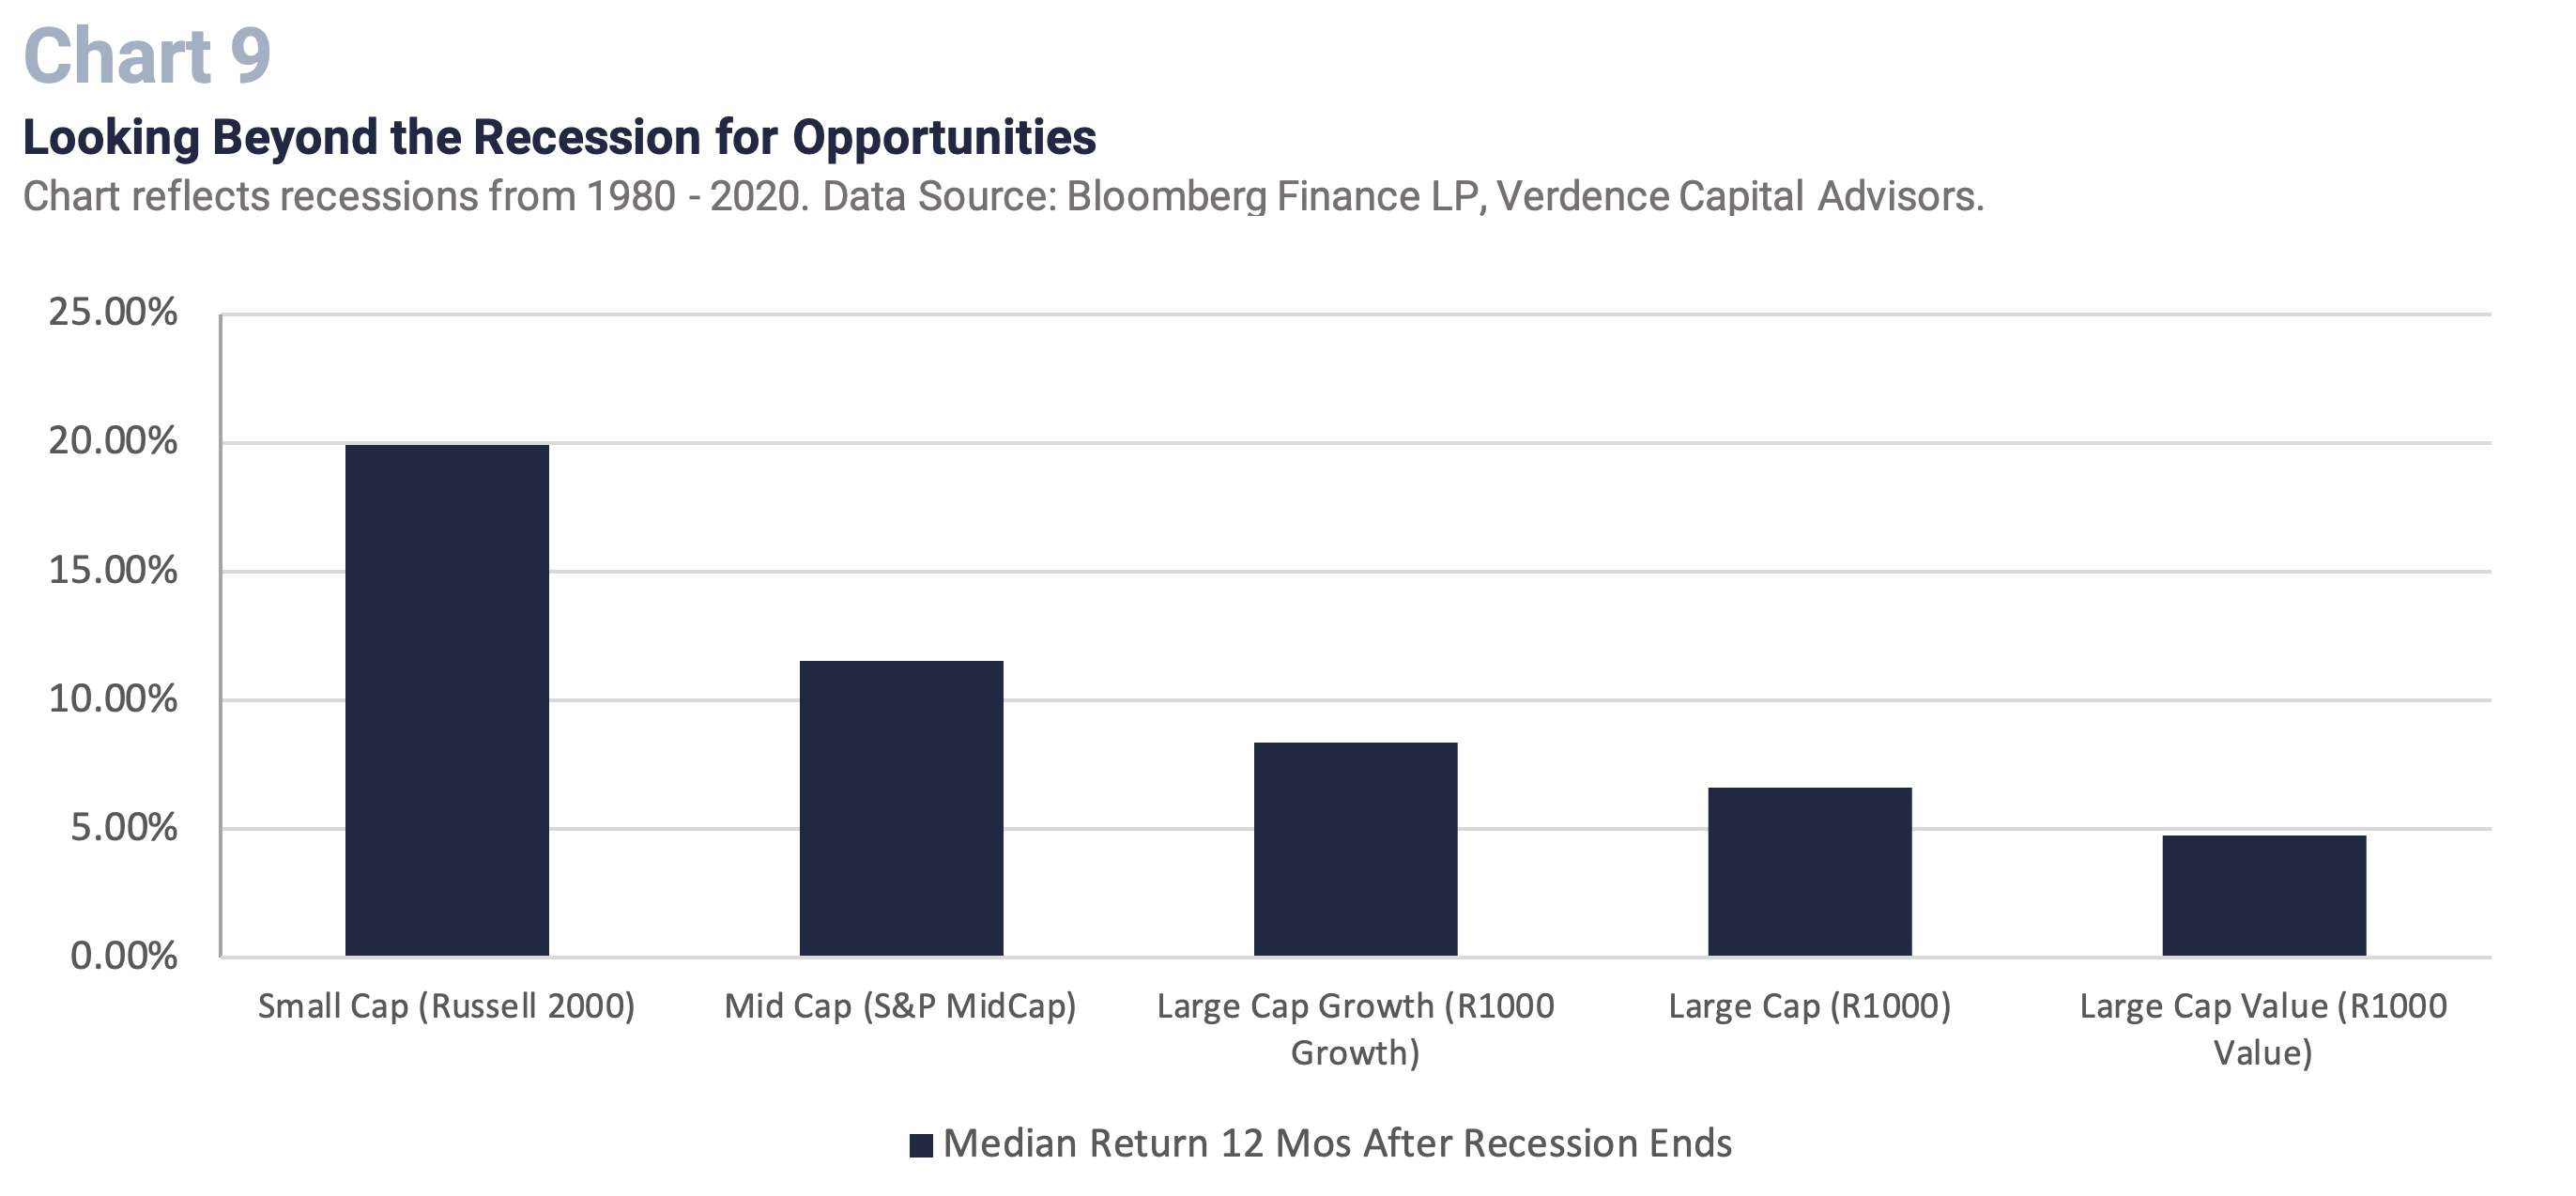
While we remain neutral on our global equity exposure currently, we are awaiting better entry points in other areas outside of the U.S. large cap space. For example, there are opportunities in U.S. small and midcap stocks which have underperformed the tech heavy large cap indices in 2023 (e.g., S&P 500, Russell 1000). The underperformance is understandable given the concern about small and midcap banks and the refinancing needs of small and midcap companies in a time when interest rates are high. However, once we get beyond the likely recession in 2024, small and midcap stocks typically perform the best coming out of a recession. (Chart 9).
In addition, we are watching the international markets as a potential opportunity. Some developed economies are in a downturn, and this is occurring while the U.S. is resilient. Therefore, we have seen Europe, the UK, Japan, and Canada significantly underperforming the U.S. large-cap indices (i.e., S&P 500 and Russell 1000). As a result, valuations in these areas are at the most attractive level on record compared to the U.S. Lastly, inflation has moderated more in our developed counterparts, and growth is slowing. Therefore, those central banks have more flexibility to stimulate their economy.
While we believe we can ultimately see the second consecutive year of attractive equity returns, it is unlikely to be a smooth ride and we expect more muted returns compared to 2023. In addition, volatility is likely to be heightened, especially given the rally in 2023 and valuations that may be stretched. We are going into 2024 with a neutral allocation versus our benchmark for our global equity exposure. In addition, we maintain a solid cash position to be able to deploy as volatility presents us with opportunities.
While we believe we will ultimately see the second consecutive year of positive equity returns, it is unlikely to be a smooth ride and we expect more muted returns compared to 2023.
Theme #5 – Fixed Income: Unprecedented Tug of War for Bonds
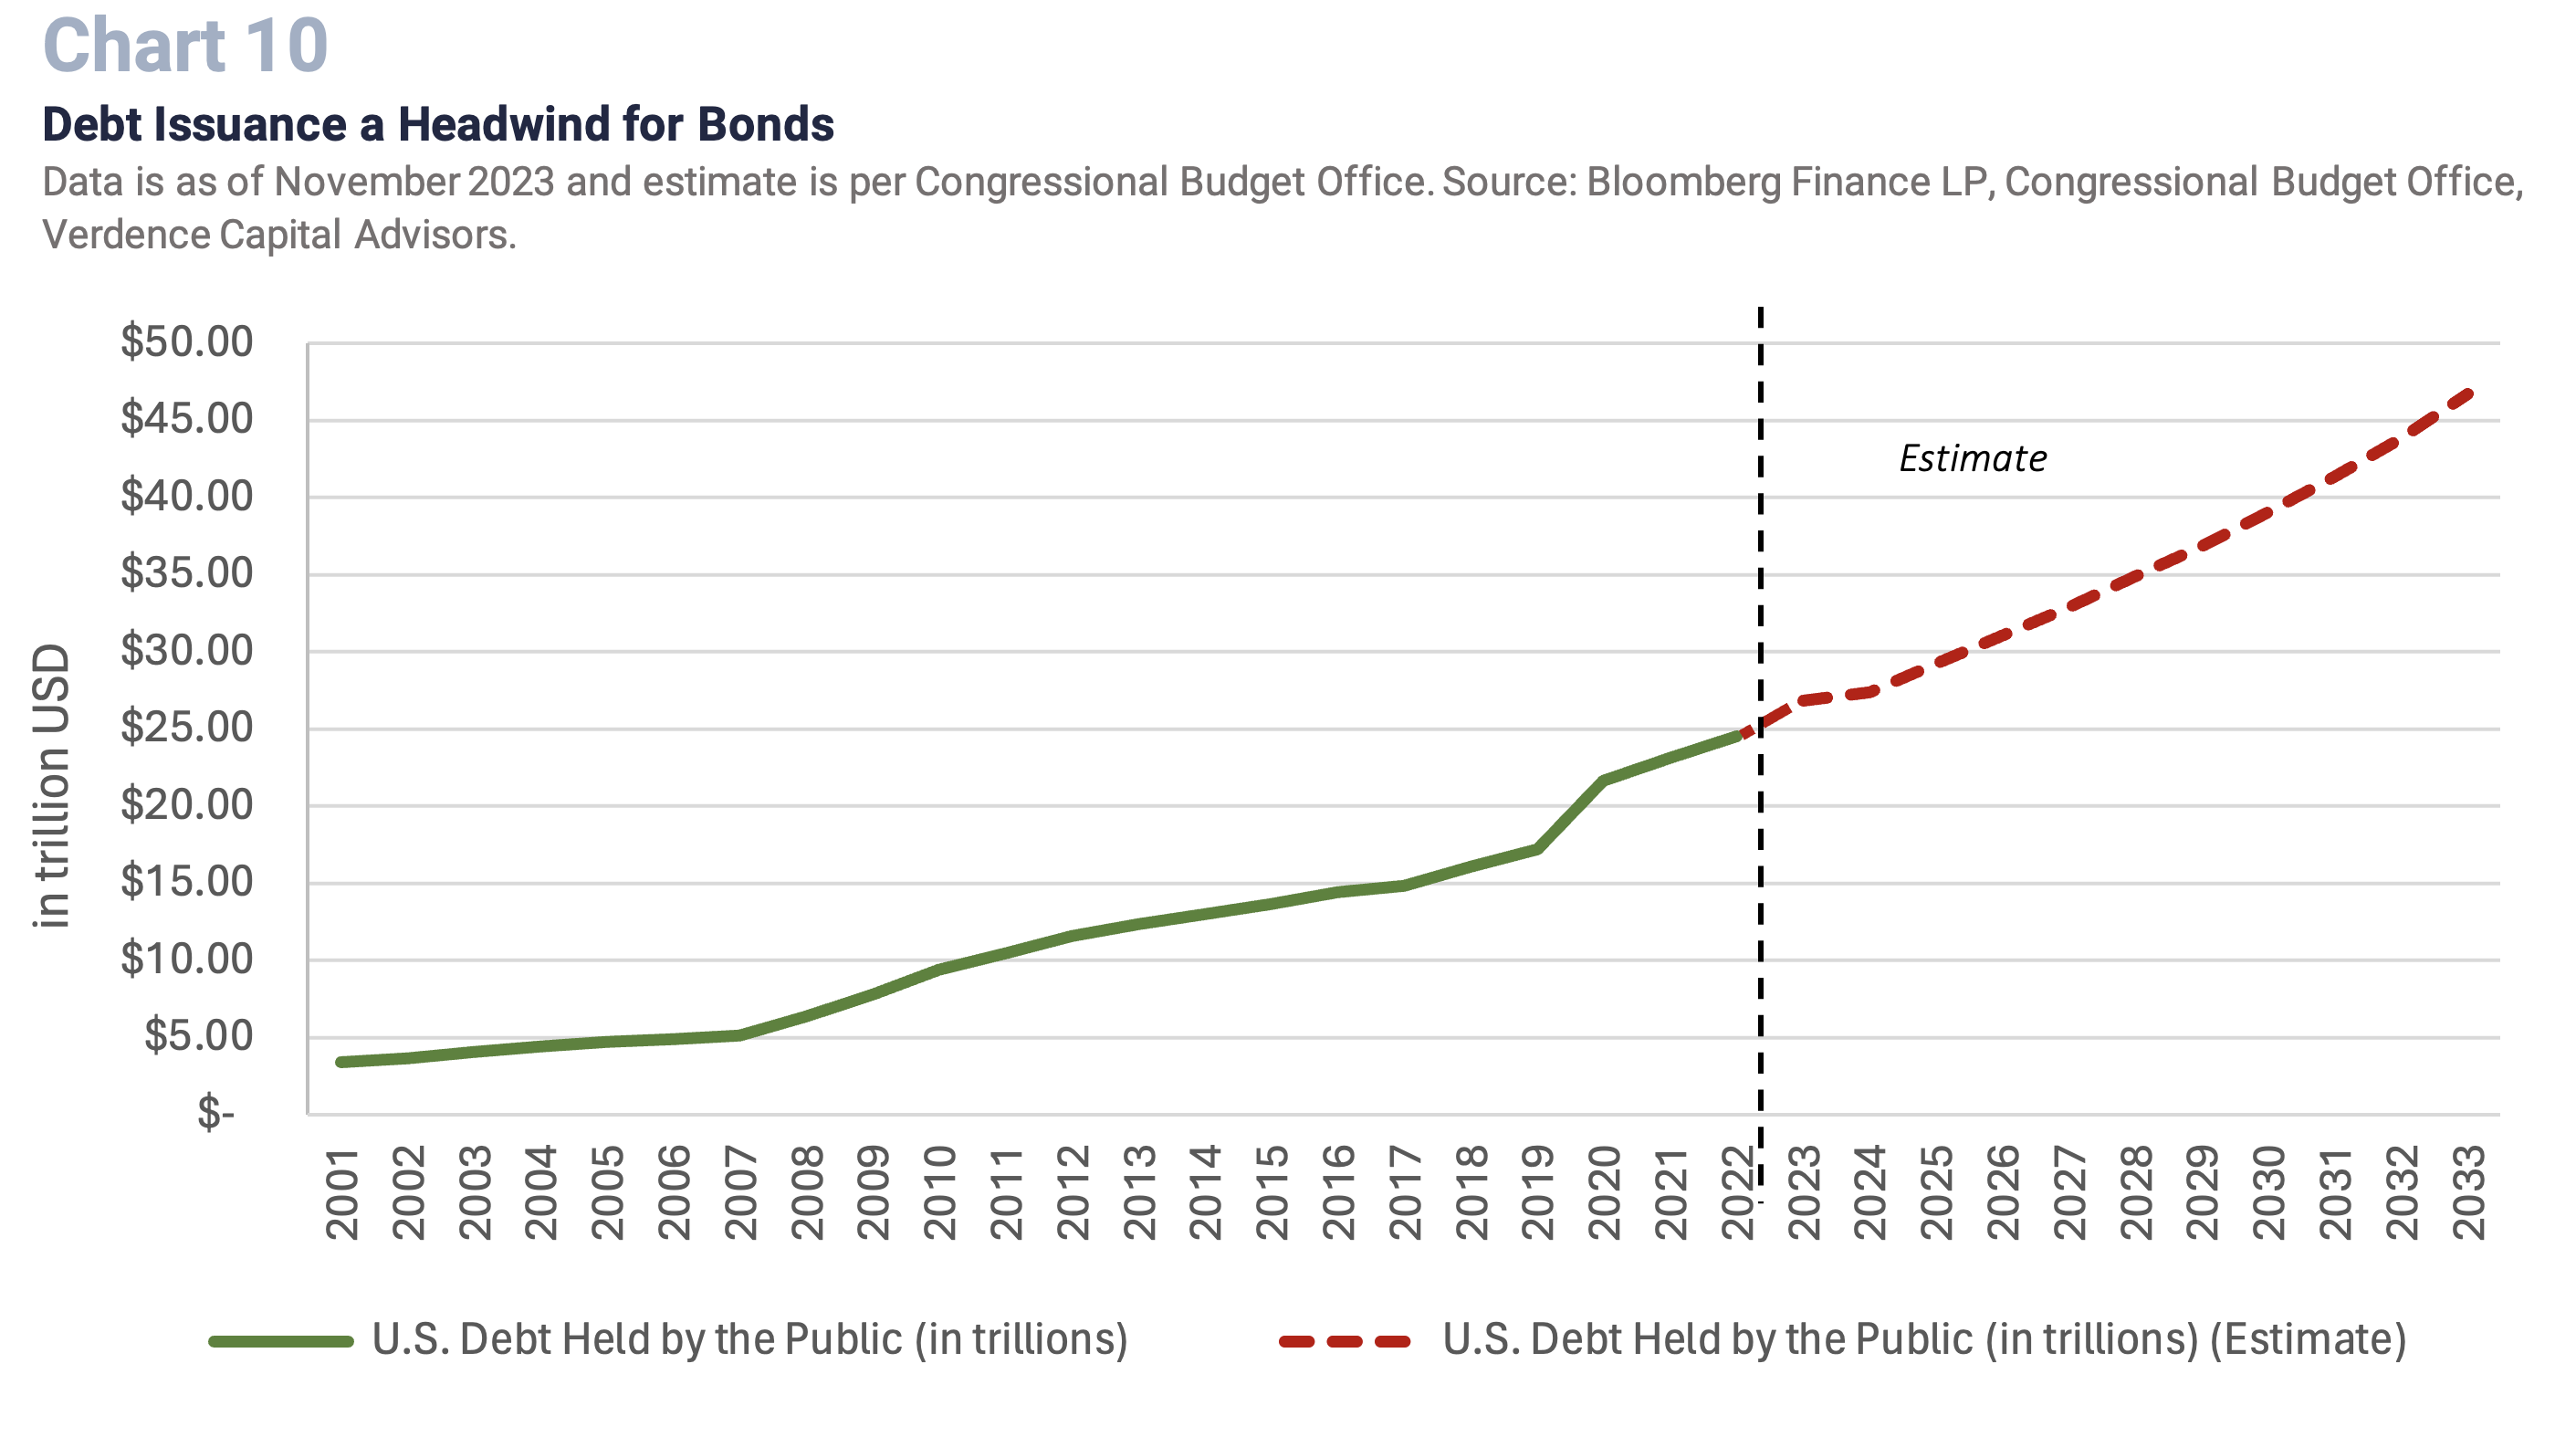
Despite the long-term Treasury yield (10YR) rising to 5.0% in 2023, the idea that the Fed is done raising rates has driven long term yields lower. In 2024 we are concerned that bonds will face an unprecedented tug of war. On one hand, yields should decline as economic growth slows and the Fed is getting ready to cut rates (late 2024 at the earliest). However, on the other hand, the debt issuance that is necessary by the U.S. government to fund our deficit is flooding the Treasury market. (Chart 10). This is occurring while global investors have pulled back from Treasury auctions and the Fed is aggressively reducing their balance sheet. We expect the auction process will continue to be messy in 2024 which should present a volatile environment for long term bonds.
- Duration recommendation: We would not recommend investing in long-term bonds at these levels. Instead, we would recommend an intermediate benchmark neutral duration (5 – 6 years). This mitigates the interest rate sensitivity and investors may also see price appreciation and capture attractive coupons.
- Credit is on borrowed time: Credit has been extraordinarily resilient in the most aggressive tightening cycle since the 1970s/1980s. Despite accelerating bankruptcies and high interest rates, companies are still borrowing, and demand has been strong. However, this may be unsustainable in 2024 as refinancing needs accelerate and credit quality gets weaker. We will be patient and look for opportunities when spreads (extra yield over Treasuries you earn for the added risk) offer an attractive risk/reward dynamic.
Theme #6 – Alternatives: Diversification Comes in Many Shapes and Sizes
For qualified investors, alternative investments can perform well in periods of economic uncertainty and even in periods of tighter lending conditions. On the private side, managers have more flexibility and time to be able to find and make good long-term investments. For clients that invest in private investments they are spared the daily volatility seen in public markets and historically have been offered an uncorrelated asset with robust risk adjusted return opportunities.
Not only are alternatives good for an added layer of asset class diversification but from a vintage year perspective, it is important to have some diversification. Historically, periods of economic weakness have offered private equity managers the opportunity to find attractive long-term investments. We like private credit but admit the space is getting crowded and due diligence is crucial. In addition, real assets may present additional opportunities, especially in the real estate space as mortgage rates peak. Lastly, we like low volatility hedge funds as a hedge for investors’ public market exposure.
The Bottom Line
While we may be more cautious than consensus opinions about the economy in 2024, that does not mean we are not constructive for the long run on the economy and equity markets. However, we do believe there is a fair price to pay for investments. We look at the interest rate, earnings, and economic environment to distinguish what that fair price is. Currently, there are too many red flags flashing for the economy, and prices in the equity and bond markets are complacent to those warning signs. Instead of chasing the consensus view and overpaying for investments we would rather have dry powder to put to work in what we expect to be a volatile year for investors. We admit that Presidential election years tend to be favorable for investors. However, we can also name some recent election years that did not bode well for investors (e.g., 2000, 2008). Politics are one of many factors that we consider when investing in the long run. Currently, the underlying fundamentals for the economy are more important. We also do not believe in chasing consensus. We have seen too often how quickly that consensus can fall out of favor, and we would rather not be running for the doors with the rest. Instead, we are patient. We are earning money on cash for the first time in decades and we will be vigilantly looking for opportunities for the long run.