White Paper Report

2024 Q1 White Paper: The End of an Era – Japan Exits “NIRP”

April 2, 2024
Download PDFWatch Video

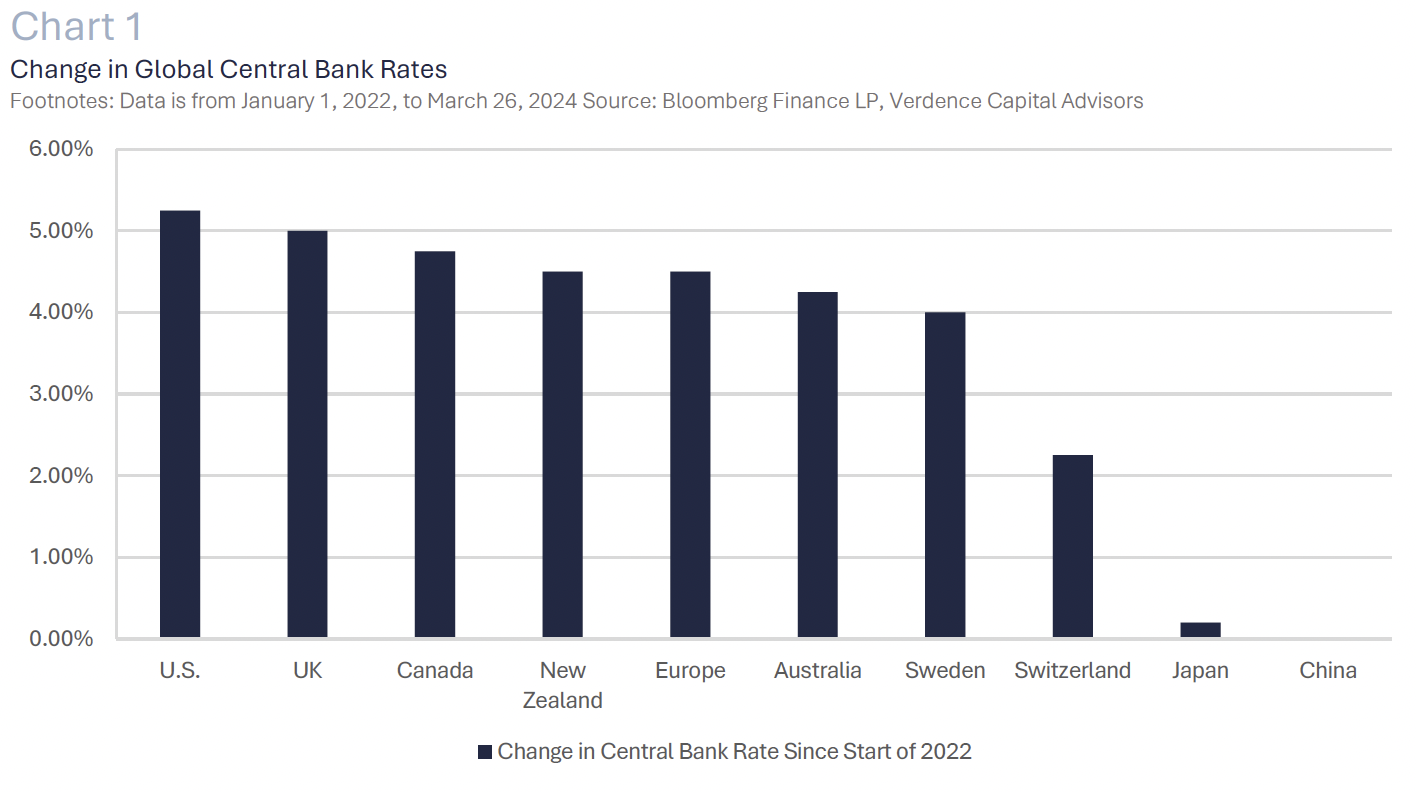
Since the start of 2022, investors have witnessed one of the most aggressive central bank tightening cycles in decades. The biggest global central banks have increased their benchmark interest rate by, on average, over 400 bps (i.e., 4.0%), with the U.S. raising rates the most (+525 bps). (Chart 1). The actions taken by these central banks have been warranted to tackle a massive inflationary cycle as we work to unwind the excess stimulus delivered to the world economy during the pandemic. Finally, on March 18, 2024, the Bank of Japan joined the other major central banks to raise interest rates for the first time in 17 years. The Bank of Japan did not just raise interest rates, they were the last central bank to end a nontraditional type of monetary policy called negative interest rate policy (a.k.a. “NIRP”) which they have had in place since 2016.


In this white paper we seek to educate our readers about what a negative interest rate policy is and why it may be used by central banks. We will discuss the reasons the Bank of Japan was finally able to abandon their negative interest rate policy. Lastly, while Japan has been the last to join the global tightening cycle, we will explain what the end of this nontraditional policy tool means for global assets.

What is Negative Interest Rate Policy, and Why Use it?

Central banks use monetary policy to support economic growth and/or maintain price stability. In times of economic weakness, central banks will cut interest rates to spur growth. In contrast, they will raise interest rates if they need to cool economic growth. From an inflation standpoint, price stability is another mandate for central banks. Central banks can raise rates to bring inflation down or cut rates if deflation (a persistent period of a decline in broad prices) or disinflation (temporary slowing in increases of inflation) threatens their long-term inflation target.

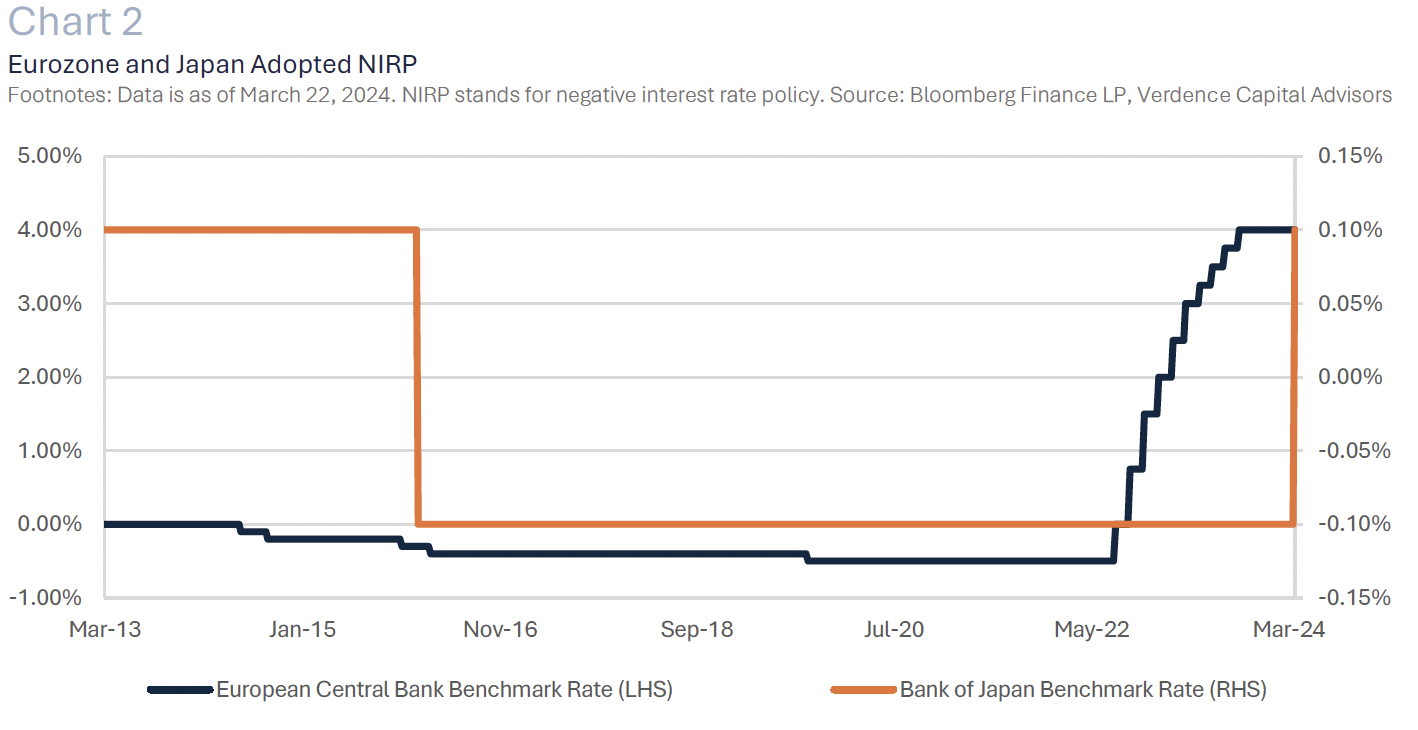
Negative interest rate policy is not a traditional monetary policy tool; it is used as a last resort.  It has been used by central banks in Europe and Japan over the past decade when they exhausted all options to avoid deflation and/or spur economic growth. After the Great Financial Crisis and the Eurozone peripheral debt crisis, a persistent period of inflation growing below the European Central Bank’s target rate ensued. As a result, the European Central Bank cut rates into negative territory in 2014 and continued cutting further into negative territory through 2019. The Bank of Japan has used negative interest rate policy since 2016 as they battled a deflationary environment. (Chart 2).

When a central bank sets a negative interest rate policy, that country’s central bank charges commercial banks to hold excess cash, and those banks do not pay interest to depositors. Even though the rate is set below zero, banks have not typically passed that onto depositors by charging them. Instead, depositors earn zero interest on the cash they hold at banks. It is hoped that this negative interest rate policy will incentivize commercial banks to lend and consumers to spend instead of hoarding cash.


How the Bank of Japan was able to Abandon Negative Interest Rate Policy

The bursting of the Japanese property and stock market bubble and policy errors in the late 1980s and early 1990s led to persistent economic volatility, deep recessions, and a deflationary spiral in prices. As a result, the Bank of Japan was forced to keep interest rates at or near zero through most of the 1990s and early 2000s with a brief move higher leading up to the Great Financial Crisis. Many historians refer to this period for Japan as the “lost decade.”1 While Japan’s aging demographics, currency volatility, and emerging Asian economies can also be pinpointed as challenges to the Japanese economy, wage stagnation was a major driver of the consistent deflationary pressures.

However, Japan has finally seen stability and even solid wage growth. Wages can be a major and difficult inflationary or deflationary challenge for a central bank to tackle. Higher wages can fuel inflation while lower wages keep prices low and fuel deflation. In the country’s annual “springtime negotiations” (March 2024), the major labor union confederation (i.e., JTUC-Rengo) announced a massive increase in the average base wage rate (3.7%), and this was after last spring’s robust increase.2 Therefore, the Bank of Japan felt that higher wages warranted an end to negative interest rate policy.

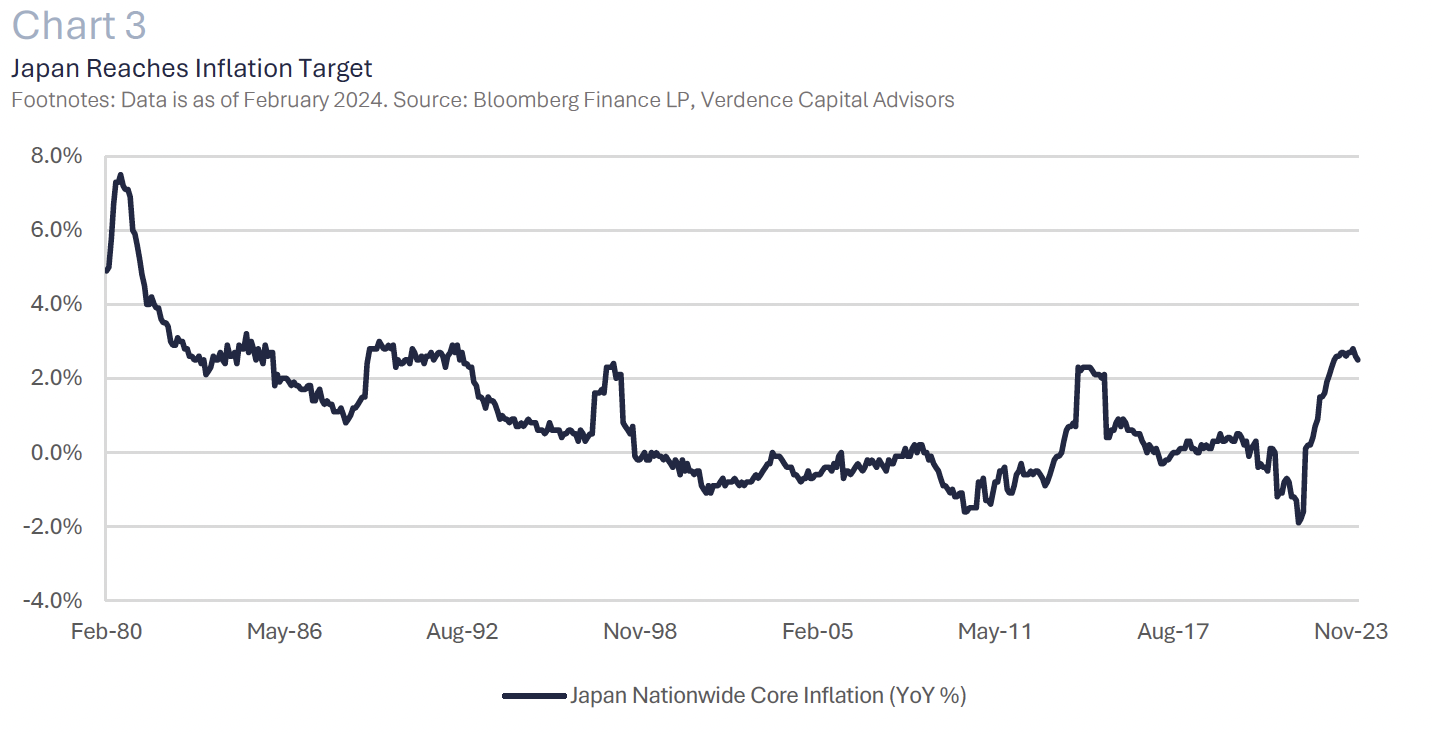
In addition, a global inflationary environment due to the aftermath of the pandemic has pushed prices higher in Japan as well. Japan’s Nationwide Consumer Price Index is growing 2.5% year over year, the highest level of inflation for the country since the early 1990s. (Chart 3). This is comfortably above the Bank of Japan’s inflation target (i.e., 2.0%) so nontraditional monetary policy was no longer needed.


What does the End of Negative Interest Rate Policy Mean for Global Assets?

The Bank of Japan’s move was not a shock to investors. However, their dovish comments after they made the announcement have muted the impact on global stocks and bonds. The Bank of Japan reiterated that they would keep an accommodative monetary policy stance and are willing to reverse course if progress on wages and inflation stalls. Therefore, it has been more of a symbolic event than a market moving event.

However, investors should be prepared that zero or negative interest rate policy is likely a thing of the past. While most central banks are gearing up to cut rates this year, we do not expect them to be able to use this nontraditional tool again unless a major economic calamity occurs. Global inflation remains a major risk, and what central banks have learned from past mistakes is that a stop-and-go monetary policy has not worked for economic growth or price stability.

For bondholders, we are settling into a new interest rate regime where peaks and lows in rates throughout economic cycles may be higher than we are accustomed to. We have seen this impact through the amount of negative-yielding debt around the world falling from over $18 trillion to less than $500 billion. (Chart 4). The long-term impact on bond investors depends on whether the Bank of Japan has more rate hikes ahead. However, what is clear is that the path forward for rates in Japan is likely higher, but the timing and magnitude are less clear. This may impact U.S. Treasuries in the long run. Japan has been one of the top three largest holders of U.S. Treasuries as negative interest rates have driven flows out of Japanese bonds to higher-yielding countries. If a Japanese investor can earn a positive yield in their own country and not have to withstand currency volatility, flows to U.S. Treasuries may moderate. This is concerning at a time when the U.S. Treasury is forecast to increase the amount of U.S. Treasury debt by ~30% in the next five years.3

For Japanese equity investors, the impact should vary across sectors over the long run. Major commercial banks should benefit as margins increase with higher interest rates. Insurers should benefit as long-term rates increase. Energy-intensive sectors may benefit if the Yen appreciates and the cost of energy resources moderates.  We expect some of the losers to Japan’s move to be real estate and homeowners as nearly three quarters of the home loans in Japan are floating rate.4 In addition, the hospitality sector may lag if the Yen appreciates and hampers tourism. Lastly, while regional banks may benefit from higher margins, we are concerned about rising defaults in “zombie companies” that were able to stay afloat due to record-low interest rates. These are referred to as “zombie companies” as they cannot keep up with debt payments with their profits alone. According to Bloomberg, one in six Japanese companies are considered “zombie banks.”5


Our View

At this point, the move by the Bank of Japan has had little impact on the global markets. This is likely because it was not a shock to the system but more of a symbolic signal. The Bank of Japan was the last standing symbol of negative interest rate policy. While the positive and negative long-term ramifications of negative interest rate policy are still being studied, we believe normalization in interest rate policy is healthier for the long run than manipulating monetary policy. The Bank of Japan being able to bring rates into positive territory reminds us that we are still working out the consequences of the pandemic, but higher highs and higher lows in interest rates are something we should get accustomed to for the long run. We are closely monitoring our exposure to Japanese equities, especially at the sector level. In addition, this confirms our cautious outlook on long-term bonds, especially in the U.S.

If you have any questions or comments, please reach out to your financial advisor.

Disclaimer: © 2024 Authored by Megan Horneman, Chief Investment Officer, Verdence Capital Advisors, LLC

Reproduction without permission is not permitted. The indexes presented are unmanaged portfolios of specified securities and do not reflect any initial or ongoing expenses nor can it be invested in directly. An investment’s portfolio may differ significantly from the securities in the index.  This material was prepared by Verdence Capital Advisors, LLC (“VCA” or “we”, “our”, “us”). VCA believes the information and data in this document were obtained from sources considered reliable and correct and cannot guarantee either their accuracy or completeness. VCA has not independently verified third-party sourced information and data. Any projections, outlooks or assumptions should not be construed to be indicative of the actual events which will occur. These projections, market outlooks or estimates are subject to change without notice. This material is being provided for informational purposes only and is not intended to provide, and should not be relied upon for, investment, accounting, legal, or tax advice. Past performance is not a guarantee of future results. Different types of investments involve varying degrees of risk, and there can be no assurance that the future performance of any specific investment, investment strategy, or product or any non-investment related content, made reference to directly or indirectly in these materials will be profitable, equal any corresponding indicated historical performance level(s), be suitable for your portfolio or individual situation, or prove successful. You should not assume that any discussion or information contained in this report serves as the receipt of, or as a substitute for, personalized investment advice from VCA. Alternative investments are designed only for sophisticated investors who are able to bear the risk of the loss of their entire investment. Investing in alternative investments should be viewed as illiquid and generally not readily marketable or transferable. Investors should be prepared to bear the financial risks of investing in an alternative investment for an indefinite period of time. Due to various factors, including changing market conditions and/or applicable laws, the content may no longer be reflective of current opinions or positions. All indexes are unmanaged, and you cannot invest directly in an index. Index returns do not include fees or expenses. Sector Watch Use of this website is intended for U.S. residents only. Any recommendation, opinion or advice regarding securities or markets contained in such material does not reflect the views of Verdence Capital, and Verdence Capital does not verify any information included in such material. Verdence Capital assumes no responsibility for any fact, recommendation, opinion, or advice contained in any such research material and expressly disclaims any responsibility for any decisions or for the suitability of any security or transaction based on it. Any decisions you may make to buy, sell, or hold a security based on this research will be entirely your own and not in any way deemed to be endorsed or influenced by or attributed to Verdence Capital. It is understood that, without exception, any order based on such research that is placed for execution is and will be treated as an UNRECOMMENDED AND UNSOLICITED ORDER. Further, Verdence Capital assumes no responsibility for the accuracy, completeness, or timeliness of any such research or for updating such research, which is subject to change without notice at any time. Verdence Capital does not provide tax, or legal advice. Under no circumstance is the information contained within this research to be used or considered as an offer to sell or a solicitation of an offer to buy any particular investment/security. Fixed income securities are subject to increased loss of principal during periods of rising interest rates. Fixed income investments are subject to various other risks including changes in credit quality, market valuations, liquidity, prepayments, early redemption, corporate events, tax ramifications and other factors. Lower rated securities are subject to greater credit risk, default risk, and liquidity risk. Commodity‐related products, including futures, carry a high level of risk and are not suitable for all investors. Commodity‐related products may be extremely volatile, illiquid and can be significantly affected by underlying commodity prices, world events, import controls, worldwide competition, government regulations, and economic conditions, regardless of the length of time shares are held. Data is provided for information purposes only and is not intended for trading purposes. Verdence Capital shall not be liable for any errors or delay in the content, or for any action taken in reliance on any content. Weekly Insights/Qtrly & Annual Outlook The indexes presented are unmanaged portfolios of specified securities and do not reflect any initial or ongoing expenses nor can it be invested in directly. An investment’s portfolio may differ significantly from the securities in the index. Semi-Annual Chart Pack Where shown, performance information presented is that which has been calculated and presented by an unaffiliated third-party manager. We have no insight into the performance of the advisor/product/account or fund shown and do not attempt to determine whether the performance presented is accurate. Therefore, the performance could be incorrect, overstated or not reflective of actual trading of client funds. There is the potential that the performance shown is a back test and not the result of real investment advice and trading. As such, it could not be relied upon as indicative of future returns of a particular strategy. Where performance shown is that of a pooled account, limited partnership, or private equity fund, you should be aware that there is a significant lack of transparency into the operations and investment process and investment vehicles invested in. As a result, pricing and valuation of the underlying holdings which produced the stated performance could be incorrect, stale, or overstated and therefore the performance figures presented cannot be relied upon. Before investing, we encourage you to request additional information, particularly performance information, of any product that you are considering for your client. You should read, as applicable, the Prospectus, SAI, Composite Disclosure and/or performance disclosure associated with any product that you are considering for investment for your or your client’s. Products shown may have minimum account sizes or minimum investments which may preclude retail and non-high net worth investors from being able to invest in these products. You should be aware that certain LPs may be closed to new investors and therefore your clients may be prevented from investing in these products. Portfolio Implementation and Rationales The SMA Asset Allocation Models do not represent a personalized recommendation of a particular investment strategy to you or your clients. You should not buy or sell an investment without first considering whether it is appropriate for your client’s portfolio. Additionally, you should review and consider any recent market news. All expressions of opinion are subject to change without notice in reaction to shifting market conditions. Data contained herein from third-party providers is obtained from what are considered reliable sources. However, its accuracy, completeness or reliability cannot be guaranteed. Supporting documentation for any claims or statistical information is available upon request. Examples provided are for illustrative purposes only and not intended to be reflective of results you can expect to achieve. Diversification and asset allocation do not ensure a profit and do not protect against losses in declining markets. Any forecasts contained herein are for illustrative purposes only, may be based upon proprietary research and are developed through analysis of historical public data. Investments in growth stocks may experience price volatility due to their sensitivity to market fluctuations and dependence on future earnings expectations. Sector allocation references to market capitalization (“smid cap” or “micro caps” etc.) may be subject to special risks given their characteristic narrow markets, limited financial resources, and less liquid stocks, all of which may cause price volatility. International/global investing can involve special risks, such as political changes and currency fluctuations. These risks are heightened in emerging markets. A significant percentage of the underlying investments in aggressive asset allocation portfolio investments have a higher-than-average risk exposure. You should consider your risk tolerance of each of your clients carefully before choosing such a strategy. An investment with multiple underlying investments (which may include asset-allocation or custom blended investments) may be subject to the expenses of those underlying investments in addition to those of the investment itself. Investments may reside in the specialty category due to 1) allowable investment flexibility that precludes classification in standard asset categories and/or 2) investment concentration in a limited group of securities or industry sectors. Investments in this category may be more volatile than less flexible and/or less concentrated investments and may be appropriate as only a minor component in an investor’s overall portfolio. Investment Managers You and your clients should carefully consider investment objectives, risks, charges, and expenses of Funds discussed. This and other important information are contained in the respective Fund prospectuses and summary prospectuses, which should be read carefully before investing. Investment portfolio statistics change over time. Current performance may be lower or higher than return data quoted herein. The investment return and the principal value of an investment will fluctuate; so, an investor’s shares/units, when redeemed, may be worth more or less than their original cost. Verdence relies heavily on unaudited third-party data. Data sources include public data, such as mutual fund data, and non-public data, such as information provided by other investment advisors and managers of limited partnership pooled accounts. Data and/or statistics included on this Portal, including references to performance, opinions, ratings, rankings, manager statistics and demographic information, product, or strategy descriptions, either quantitative or qualitative, are based upon information reasonably available to us as of the applicable date(s) then-published. Information has been obtained from sources that we believe to be reliable, but these sources cannot be guaranteed as to their accuracy or completeness. All data and information produced by a third party has the potential to be incorrect, incomplete, or otherwise misleading. No implication shall be created that the information contained on the Site is correct, including as of any time subsequent to the publish date, and Verdence does not undertake an obligation to update such information at any time after such date. Verdence makes not warranty or representation of the veracity of the data and information and its use of the information should not be implied as an endorsement of any material or statements made. Data, particularly non-public data, is subject to error and where the information is not audited, the potential for error is greater. Where shown, performance information presented is that which has been calculated and presented by an unaffiliated third-party manager. We have no insight into the performance of the advisor/product/account or fund shown and do not attempt to determine whether the performance presented is accurate. Therefore, the performance could be incorrect, overstated or not reflective of actual trading of client funds. There is the potential that the performance shown is a back test and not the result of real investment advice and trading. As such, it could not be relied upon as indicative of future returns of a particular strategy. Where performance shown is that of a pooled account, limited partnership, or private equity fund, you should be aware that there is a significant lack of transparency into the operations and investment process and investment vehicles invested in. As a result, pricing and valuation of the underlying holdings which produced the stated performance could be incorrect, stale, or overstated and therefore the performance figures presented cannot be relied upon. Before investing, we encourage you to request additional information, particularly performance information, of any product that you are considering for your client. You should read, as applicable, the Prospectus, SAI, Composite Disclosure and/or performance disclosure associated with any product that you are considering for investment for your or your client’s. Certain products shown may have account minimums or minimum investment sizes that are unattainable for your clients and therefore they may not be eligible to invest in these products. Reference to registration with the Securities and Exchange Commission (“SEC”) does not imply that the SEC has endorsed or approved the qualifications of Verdence or its respective representatives to provide any advisory services described on the Site.

Read more