White Paper Report

2023 Q3 White Paper: The Health of the Chinese Economy

September 14, 2023
Download PDFWatch Video

In the years leading up to the COVID pandemic, many economists and academics estimated that China’s economy would replace the U.S. as the largest global economy by as early as 2030. China’s soaring property market, rising middle class, technological advancements and its spot as the leading global exporter would be enough to overtake the U.S. However, in recent months we are witnessing a rapid deterioration in not only economic growth, but the Chinese currency, consumer and investor confidence and the hopes that China can take over the U.S. by the end of the decade.

We realize we cannot cover all the complexities of the Chinese economy in one white paper so here we will focus on a brief history of China’s rise to be a global superpower, the recent obstacles that can be drawn back to the policies implemented over past decades and whether this may be buying opportunity for Chinese equities.

China: From an Emerging Economy to a Global Superpower

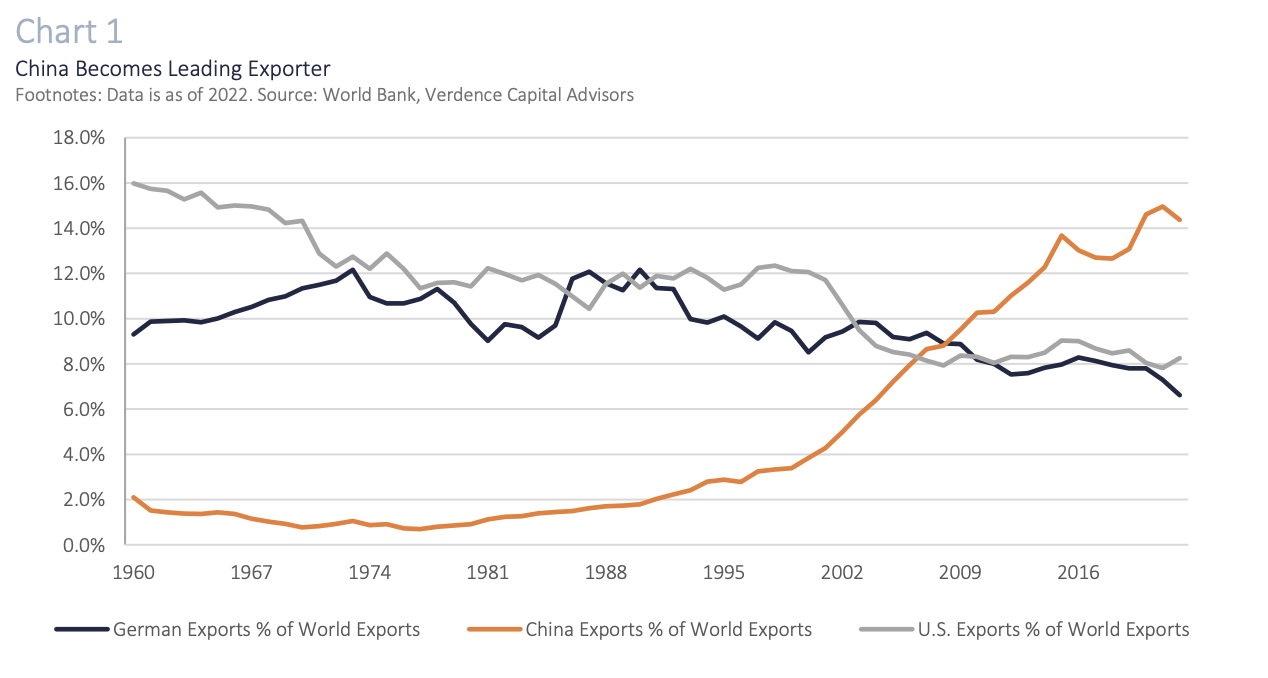
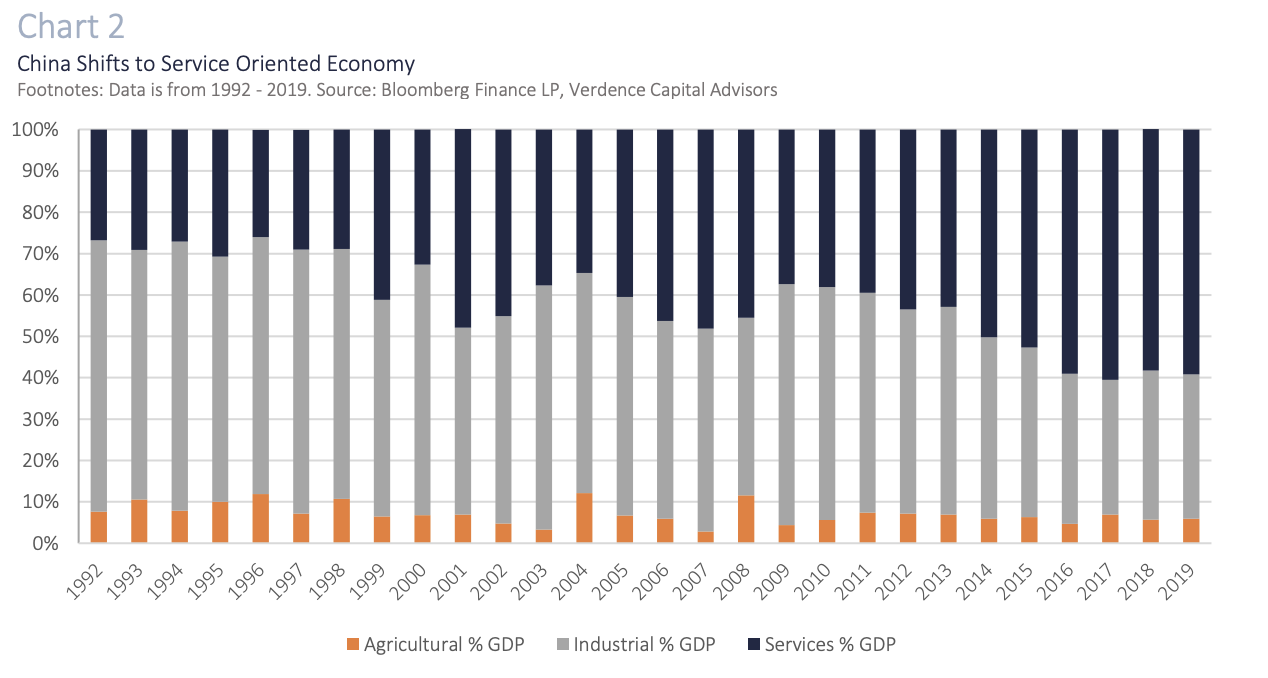
The transformation of China into a global superpower has been swift but not always smooth. China has faced many obstacles with periods of economic stagnation, civil unrest, and geopolitical turmoil. However, by the 1980sChinese leadership was focused on reforms, lifting the incomes of the lower and middle class, and attracting foreign capital through tax incentives.1 By the 1990s China was experiencing a plethora of capital inflows from international investors and from companies that wanted to take advantage of low labor costs and connect themselves with international trade. As a result, in 2009, China became the world’s largest exporting country, surpassing both the U.S. and Germany. (Chart 1). There was also a push to shift their economy from a rural agricultural base to a more urbanized service-oriented country. In fact, the service sector made up ~30% of their economy in 2000 and in the year before the pandemic (2019) it made up ~60% of the economy. (Chart 2). As citizens shifted to urban areas, a property boom began in the early 2000s. To further incentivize people to move, the government shifted from state-owned real estate to private homeownership. They encouraged banks to provide attractive lending rates to hopeful homeowners and construction companies began buying up land at a rapid pace. Then came the global financial crisis in 2007-2009. Governments around the world implemented massive stimulus packages and the Chinese government concentrated their stimulus on more housing, infrastructure, and transportation. This helped China avert the worst of the global downturn. However, the fiscal actions instigated careless property management and lending practices, pushed housing prices higher, fueling speculative buying and ultimately creating an inflationary environment. The only solution for the Chinese Government has been to try to cool the property bubble.


China’s Structural Challenges

Despite China’s size, population, and far-reaching Government power, they are not immune to booms and busts like all economies. To slow the overheating property market and bring inflation down, the Government has been forced to implement restrictive policies on speculators (e.g., higher downpayments and taxes on multiple homes). However, housing is just one of the many challenges plaguing the economy at this point. Below is a list of the main factors affecting growth for the world’s second largest economy.

  • Property bubble bursting: The Chinese real estate bubble is bursting. According to data from the China Real Estate Information Corporation, new home sales by the top 100 developers dropped 33% in July compared to a year earlier.2 Home prices are broadly falling and the decline in real estate is exposing bigger problems. Most property developers relied heavily on debt and turned to the shadow banking system for funding. The shadow banking system exploded after the GreatFinancial Crisis as property developers needed funding outside of traditional Chinese banks due to regulatory limitations, limited supply of credit and the Chinese Government’s control over interest rates.3 The shadow banking companies and securities firms. These products are typically linked to the value of real estate. However, with the property market deteriorating, developers are walking away from projects (some of which they have taken money from homeowners) and bankruptcies have been piling up. With some well-known developers filing for bankruptcy or missing debt payments (e.g., Evergrande, Country Garden) the focus is turning to the exposure in the shadow banking system with some also recently missing payments to investors (e.g., Zhrongrong Intl. Trust).
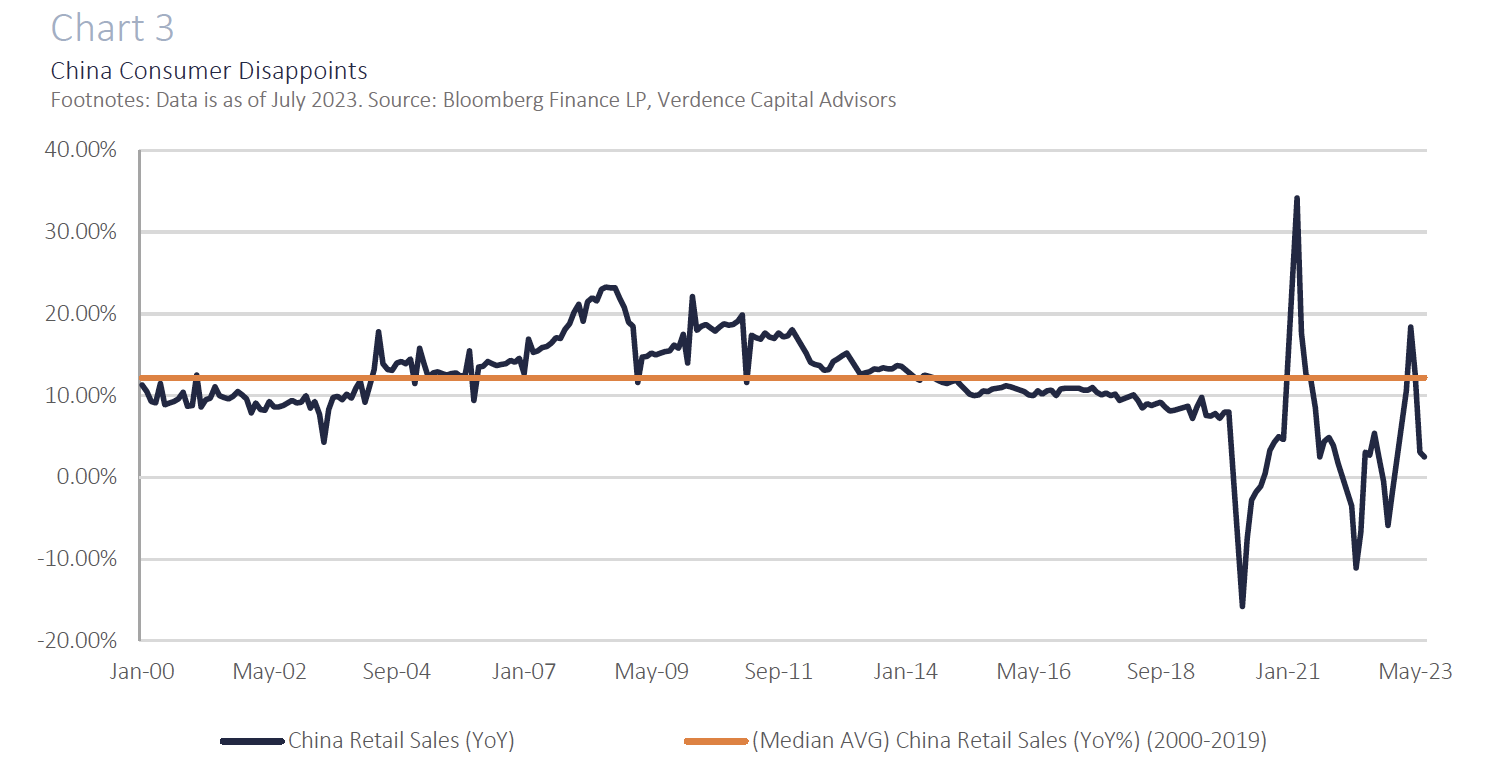
  • Consumer Slowdown: The Chinese government has depended on consumer spending to cushion the blow from the deteriorating housing market. However, many Chinese citizens have also invested heavily in real estate as an investment and are now squeezed. The pent-up demand spending after the long-awaited reopening of China due to COVID has been disappointing. Retail sales jumped nearly 20% (YoY) earlier this year and are now growing 2.5% (YoY), well below the pre-pandemic spending trend (average ~12% YoY growth in sales). (Chart 3).
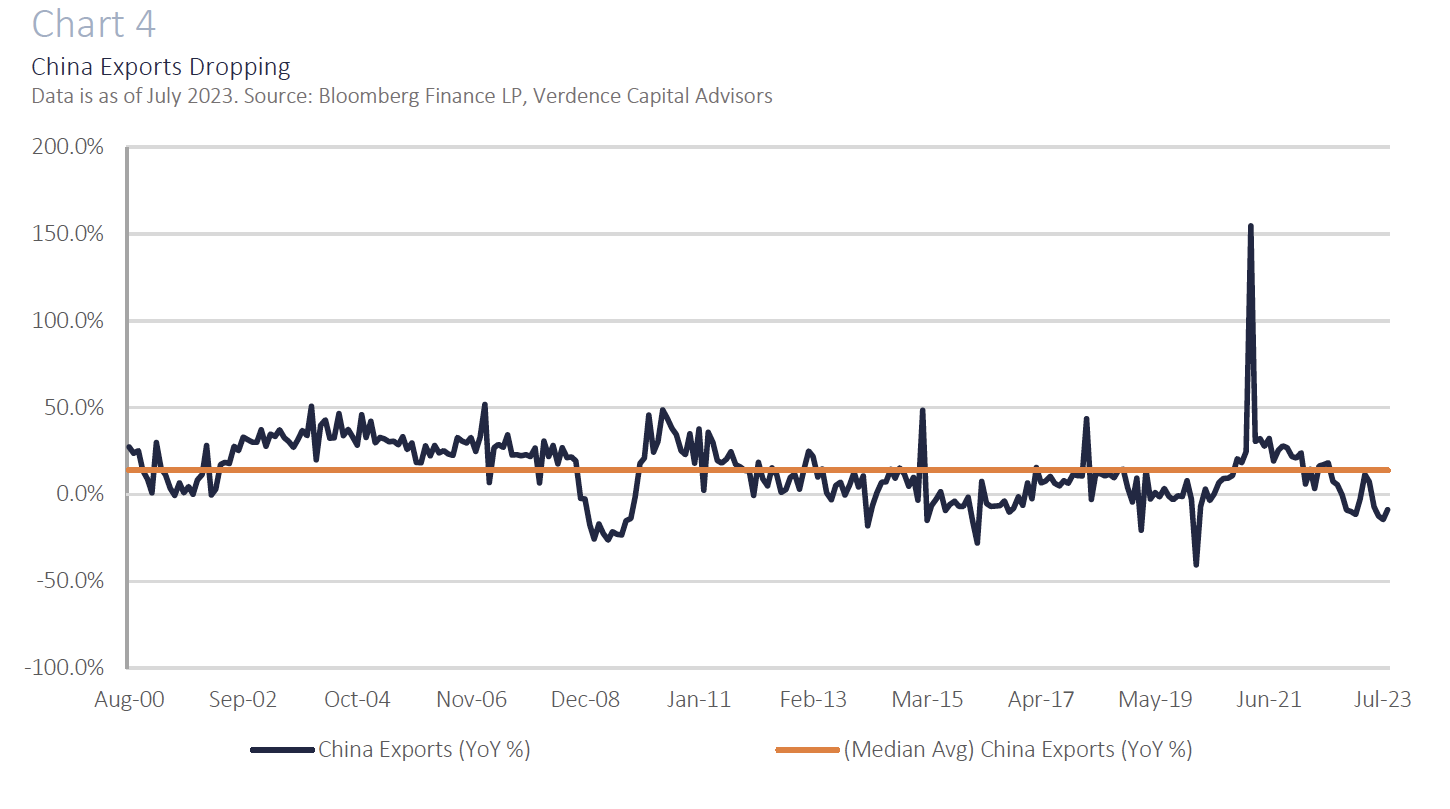
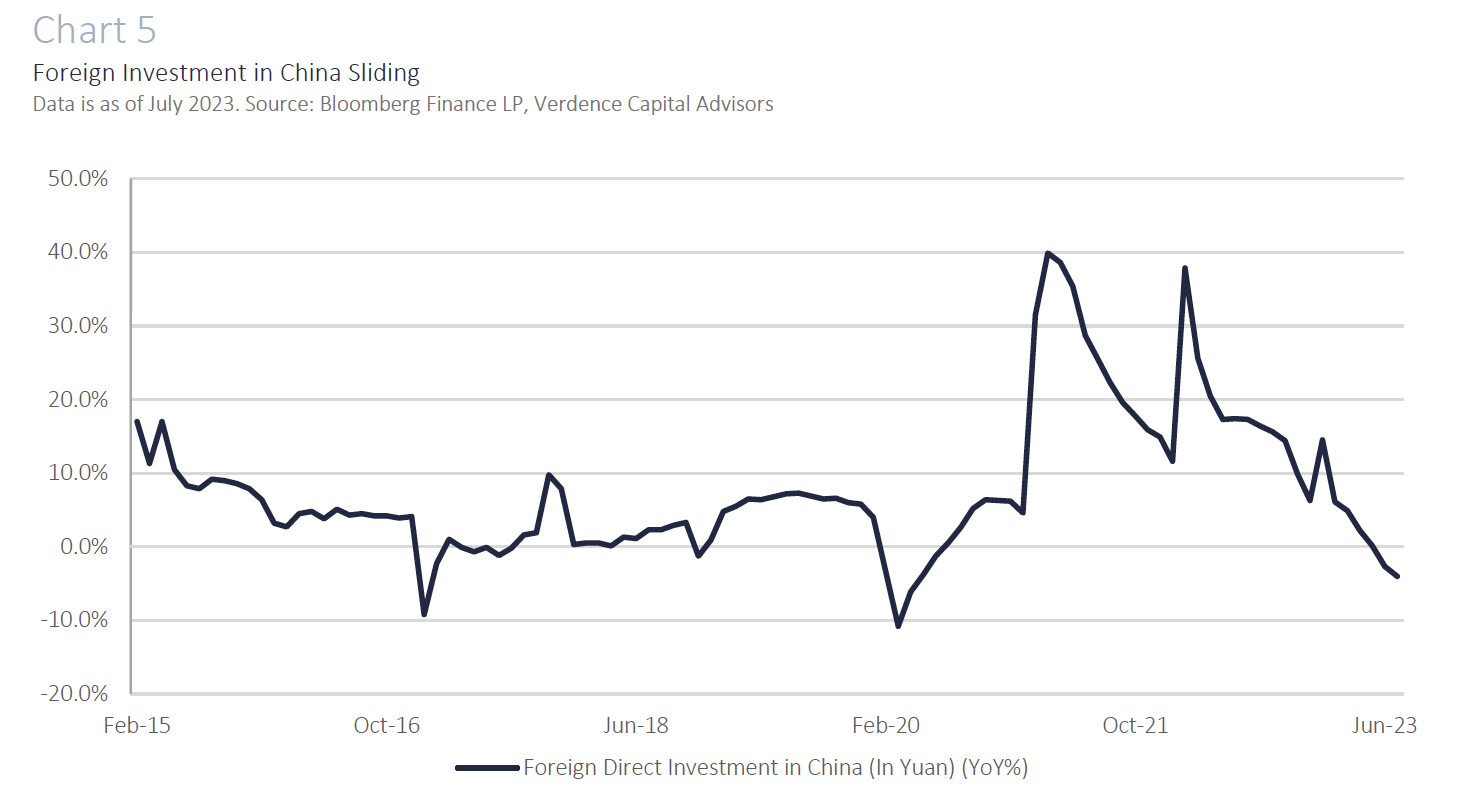
  • No longer an export behemoth: Chinese exports declined for the fourth consecutive month in August and fell for the ninth month out of the past 11. (Chart 4). This is partially due to slowing global demand but also due to companies diversifying their manufacturing needs after lessons from the pandemic (e.g., supply chain disruptions, rolling lockdowns). In addition, rising labor costs, the U.S./China trade war, domestic political controls, and geopolitical risks are deterring companies from relying too much on China for production. As a result, foreign direct investment has plummeted. (Chart 5). A recent survey by the European Chamber of Commerce in China “noted that one quarter of its members currently operating in China were considering closing and moving their operations elsewhere.”4 In addition, some major U.S. tech companies are shifting some of their production to other countries (e.g., Apple, Google).
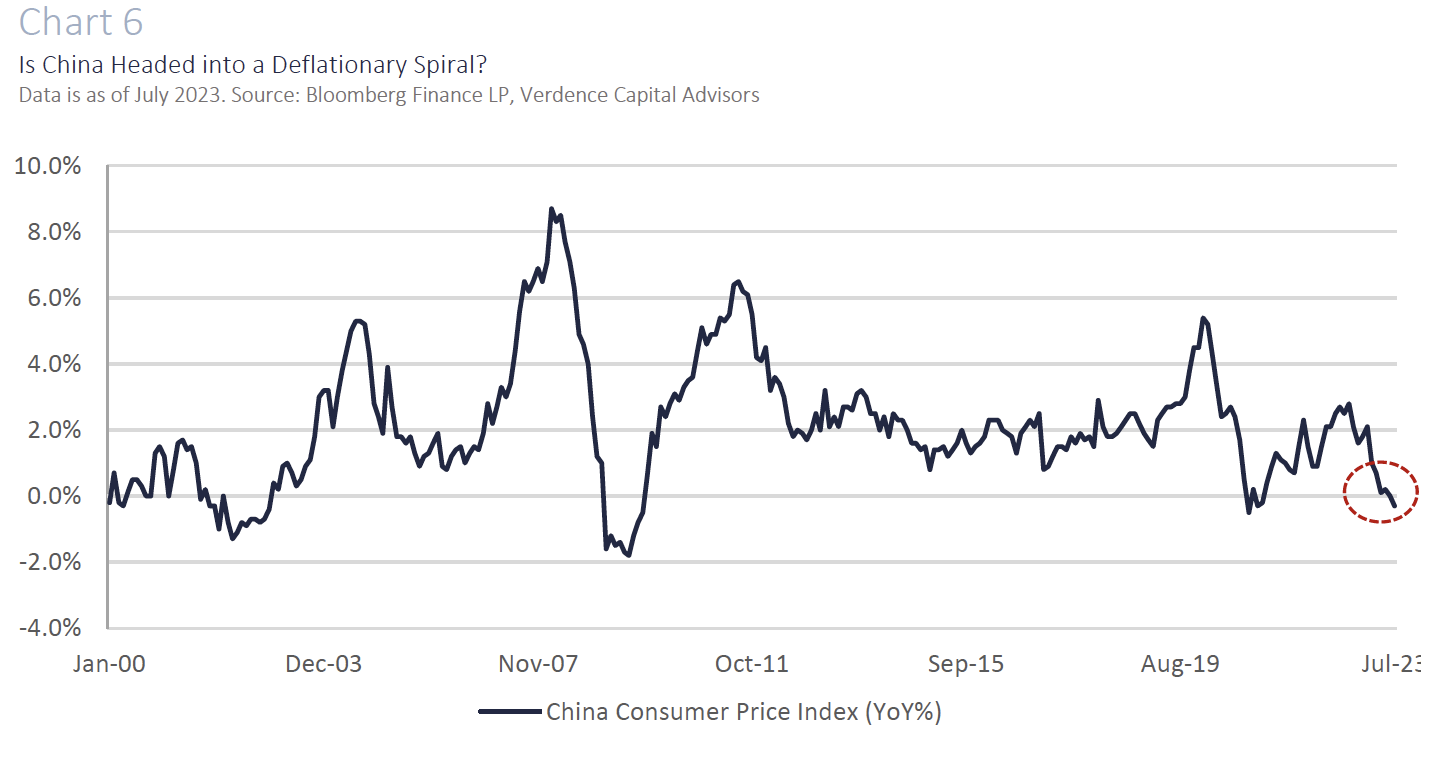
  • Deflation risks: The deterioration in home prices, deleveraging in the property market, slowing consumer spending, and the weakest economic growth in decades are also resulting in deflation fears. China’s Consumer Price Index dipped negative on a year-over-year basis in July, the first negative reading since the pandemic (Chart 6). While one-off factors (e.g., commodities) have been blamed for the decline in July, current estimates show inflation to be very tepid in the coming quarters.
  • Currency decline: As investors pull money from China, the economy weakens and interest rate differentials remain wide between the U.S. and China, the Chinese Yuan has declined to a 16-year low versus the U.S. dollar. This is concerning if China is deliberately opting to keep the currency weak to boost exports. This has been a constant cause of tension between China and many global Governments as China goods look cheaper compared to their global counterparts. It could also result in speculation/mistrust that China is looking to change its policy to keep the Yuan stable (China allows an up or down movement of Yuan of 2% per day).
  • Local debt a challenge: The loss of revenue from real estate, slowing economy and lingering damage from COVID lockdowns has resulted in soaring local debt also known as LGFVs (Local Government Finance Vehicles) (76% of GDP). The growth in LGFVs is a threat to China’s economic growth especially if there are widespread defaults that force the Chinese Government to intervene.
  • Demographics worsening: In 2022, the Chinese population declined for the first time since the 1960’s. The “one child” policy introduced in the 1980s is showing its negative ramifications. The fertility rate has declined from 7.5 births per woman in the 1960s to ~1.0 births per woman now. However, it is not just past policies, the Chinese population are having less children. This is trouble for many areas of the economy including the property market. According to the United Nations the portion of the population relied upon to clear up real estate excesses (25-39) is expected to fall more rapidly over the next 10 years.5 Declining demographics is also a concern for social programs and retirement systems. For example, according to the Brookings Institute, China’s working age population peaked in 2011 at 900 million and will decline to ~700 million by mid-century. Those 700 million will need to support the estimated 500 million Chinese citizens over the age of 60 (compared to 200 million over 60 currently).6
  • Young employment concerning: After the youth unemployment rate hit 21.3% in June, the National Bureau of Statistics in China announced it will stop releasing data. Rising youth unemployment has been driven by education disruption and limited job prospects for the younger population due to COVID lockdowns. In addition, there are skill mismatches as young workers often are employed in the services industry, which is still struggling from COVID related weakness.7 Lastly, the slowdown in economic growth has led companies to be hesitant to add employees, especially young employees who require training.


Despite China’s size, population, and far-reaching Government power, they are not immune to booms and busts like all economies.

Is China a Buying Opportunity?

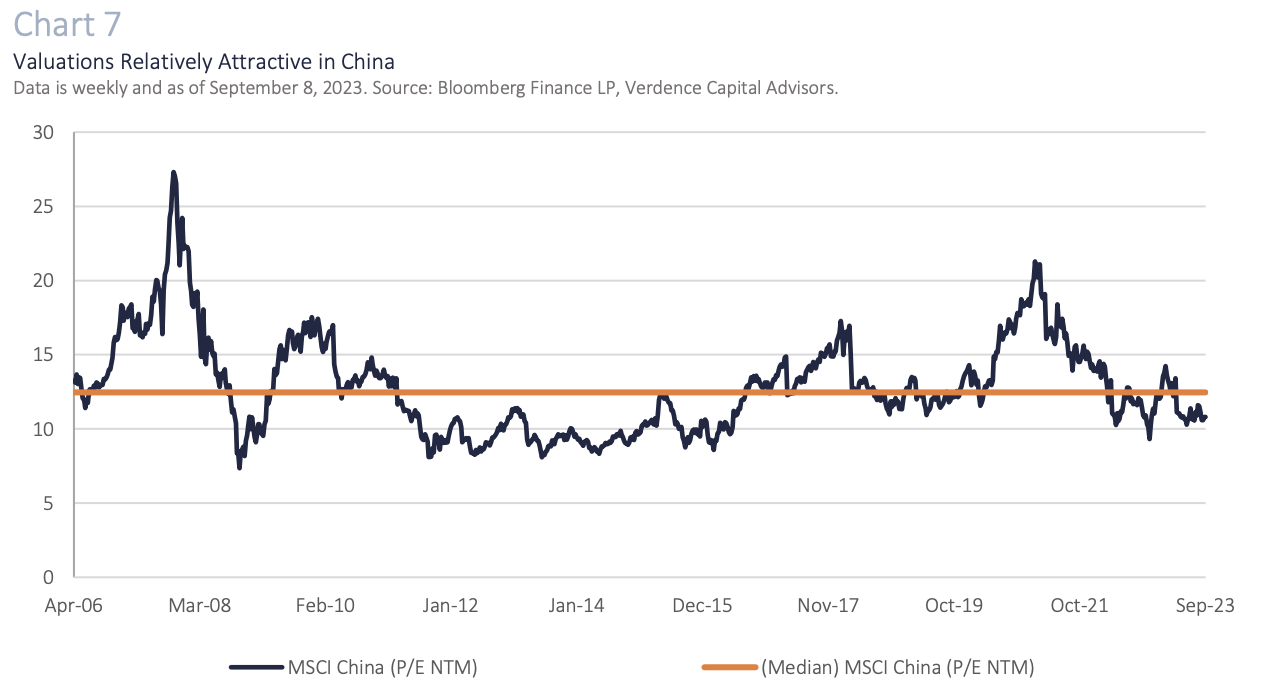
Chinese equities are lagging the rest of the world this year because of their many challenges. The MSCI China Index is underperforming the broad MSCI EM Index by over 900 bps and underperforming the MSCI AC World Index by over 1800 bps.8 As a result, valuations when looking at the forward price to earnings multiple are at a discount to their historical average. (Chart 7). Emerging market equities are an important part of a well-diversified portfolio and China is a major portion of the MSCI EM Index (~30% of the Index). Therefore, it is difficult to completely ignore Chinese equities in a well-diversified portfolio. However, we are cautious about the asset class and recommend a neutral to slight underweight allocation for more conservative investors. Active management is crucial in the space as good managers can pick companies that are less dependent on the domestic Chinese economy and more multinational and may be better equipped to navigate the challenging political climate.


The “one child” policy introduced in the 1980s is showing its negative ramifications.

Our View

China is facing significant economic and political challenges. Some have to do with their responses to the COVID pandemic, but it does not stop there. The bill for years of over investment and leverage is finally coming due. Thus far, China has announced targeted stimulus measures (e.g., lowering rates, increasing market liquidity, easing property buying restrictions), but we have not seen the “bazooka” of stimulus. As a result, Chinese citizens and global investors have not responded as well as the Government would like to see. In addition, the scars from the Russia/Ukraine war and China’s ongoing aggression in the South China Sea make international investors nervous about investing in the country. The rest of the world is not immune if there is a prolonged slowdown in the Chinese economy. On the positive side, disinflation or deflation in China can help the developed nations that are dealing with elevated inflation. On the negative side, the emerging Chinese consumer has been a theme that has helped other export driven nations and will be a headwind if their willingness to spend remains tepid. In addition, the lack of transparency and uncertainty from a political standpoint is a concern that can further damage global partnerships. We will continue to monitor the Chinese Government’s response and weigh the ongoing risk with the reward if a buying opportunity arises.

If you have any questions or comments, please reach out to your financial advisor.

Disclaimer: © 2024 Authored by Megan Horneman, Chief Investment Officer, Verdence Capital Advisors, LLC

Reproduction without permission is not permitted. The indexes presented are unmanaged portfolios of specified securities and do not reflect any initial or ongoing expenses nor can it be invested in directly. An investment’s portfolio may differ significantly from the securities in the index.  This material was prepared by Verdence Capital Advisors, LLC (“VCA” or “we”, “our”, “us”). VCA believes the information and data in this document were obtained from sources considered reliable and correct and cannot guarantee either their accuracy or completeness. VCA has not independently verified third-party sourced information and data. Any projections, outlooks or assumptions should not be construed to be indicative of the actual events which will occur. These projections, market outlooks or estimates are subject to change without notice. This material is being provided for informational purposes only and is not intended to provide, and should not be relied upon for, investment, accounting, legal, or tax advice. Past performance is not a guarantee of future results. Different types of investments involve varying degrees of risk, and there can be no assurance that the future performance of any specific investment, investment strategy, or product or any non-investment related content, made reference to directly or indirectly in these materials will be profitable, equal any corresponding indicated historical performance level(s), be suitable for your portfolio or individual situation, or prove successful. You should not assume that any discussion or information contained in this report serves as the receipt of, or as a substitute for, personalized investment advice from VCA. Alternative investments are designed only for sophisticated investors who are able to bear the risk of the loss of their entire investment. Investing in alternative investments should be viewed as illiquid and generally not readily marketable or transferable. Investors should be prepared to bear the financial risks of investing in an alternative investment for an indefinite period of time. Due to various factors, including changing market conditions and/or applicable laws, the content may no longer be reflective of current opinions or positions. All indexes are unmanaged, and you cannot invest directly in an index. Index returns do not include fees or expenses. Sector Watch Use of this website is intended for U.S. residents only. Any recommendation, opinion or advice regarding securities or markets contained in such material does not reflect the views of Verdence Capital, and Verdence Capital does not verify any information included in such material. Verdence Capital assumes no responsibility for any fact, recommendation, opinion, or advice contained in any such research material and expressly disclaims any responsibility for any decisions or for the suitability of any security or transaction based on it. Any decisions you may make to buy, sell, or hold a security based on this research will be entirely your own and not in any way deemed to be endorsed or influenced by or attributed to Verdence Capital. It is understood that, without exception, any order based on such research that is placed for execution is and will be treated as an UNRECOMMENDED AND UNSOLICITED ORDER. Further, Verdence Capital assumes no responsibility for the accuracy, completeness, or timeliness of any such research or for updating such research, which is subject to change without notice at any time. Verdence Capital does not provide tax, or legal advice. Under no circumstance is the information contained within this research to be used or considered as an offer to sell or a solicitation of an offer to buy any particular investment/security. Fixed income securities are subject to increased loss of principal during periods of rising interest rates. Fixed income investments are subject to various other risks including changes in credit quality, market valuations, liquidity, prepayments, early redemption, corporate events, tax ramifications and other factors. Lower rated securities are subject to greater credit risk, default risk, and liquidity risk. Commodity‐related products, including futures, carry a high level of risk and are not suitable for all investors. Commodity‐related products may be extremely volatile, illiquid and can be significantly affected by underlying commodity prices, world events, import controls, worldwide competition, government regulations, and economic conditions, regardless of the length of time shares are held. Data is provided for information purposes only and is not intended for trading purposes. Verdence Capital shall not be liable for any errors or delay in the content, or for any action taken in reliance on any content. Weekly Insights/Qtrly & Annual Outlook The indexes presented are unmanaged portfolios of specified securities and do not reflect any initial or ongoing expenses nor can it be invested in directly. An investment’s portfolio may differ significantly from the securities in the index. Semi-Annual Chart Pack Where shown, performance information presented is that which has been calculated and presented by an unaffiliated third-party manager. We have no insight into the performance of the advisor/product/account or fund shown and do not attempt to determine whether the performance presented is accurate. Therefore, the performance could be incorrect, overstated or not reflective of actual trading of client funds. There is the potential that the performance shown is a back test and not the result of real investment advice and trading. As such, it could not be relied upon as indicative of future returns of a particular strategy. Where performance shown is that of a pooled account, limited partnership, or private equity fund, you should be aware that there is a significant lack of transparency into the operations and investment process and investment vehicles invested in. As a result, pricing and valuation of the underlying holdings which produced the stated performance could be incorrect, stale, or overstated and therefore the performance figures presented cannot be relied upon. Before investing, we encourage you to request additional information, particularly performance information, of any product that you are considering for your client. You should read, as applicable, the Prospectus, SAI, Composite Disclosure and/or performance disclosure associated with any product that you are considering for investment for your or your client’s. Products shown may have minimum account sizes or minimum investments which may preclude retail and non-high net worth investors from being able to invest in these products. You should be aware that certain LPs may be closed to new investors and therefore your clients may be prevented from investing in these products. Portfolio Implementation and Rationales The SMA Asset Allocation Models do not represent a personalized recommendation of a particular investment strategy to you or your clients. You should not buy or sell an investment without first considering whether it is appropriate for your client’s portfolio. Additionally, you should review and consider any recent market news. All expressions of opinion are subject to change without notice in reaction to shifting market conditions. Data contained herein from third-party providers is obtained from what are considered reliable sources. However, its accuracy, completeness or reliability cannot be guaranteed. Supporting documentation for any claims or statistical information is available upon request. Examples provided are for illustrative purposes only and not intended to be reflective of results you can expect to achieve. Diversification and asset allocation do not ensure a profit and do not protect against losses in declining markets. Any forecasts contained herein are for illustrative purposes only, may be based upon proprietary research and are developed through analysis of historical public data. Investments in growth stocks may experience price volatility due to their sensitivity to market fluctuations and dependence on future earnings expectations. Sector allocation references to market capitalization (“smid cap” or “micro caps” etc.) may be subject to special risks given their characteristic narrow markets, limited financial resources, and less liquid stocks, all of which may cause price volatility. International/global investing can involve special risks, such as political changes and currency fluctuations. These risks are heightened in emerging markets. A significant percentage of the underlying investments in aggressive asset allocation portfolio investments have a higher-than-average risk exposure. You should consider your risk tolerance of each of your clients carefully before choosing such a strategy. An investment with multiple underlying investments (which may include asset-allocation or custom blended investments) may be subject to the expenses of those underlying investments in addition to those of the investment itself. Investments may reside in the specialty category due to 1) allowable investment flexibility that precludes classification in standard asset categories and/or 2) investment concentration in a limited group of securities or industry sectors. Investments in this category may be more volatile than less flexible and/or less concentrated investments and may be appropriate as only a minor component in an investor’s overall portfolio. Investment Managers You and your clients should carefully consider investment objectives, risks, charges, and expenses of Funds discussed. This and other important information are contained in the respective Fund prospectuses and summary prospectuses, which should be read carefully before investing. Investment portfolio statistics change over time. Current performance may be lower or higher than return data quoted herein. The investment return and the principal value of an investment will fluctuate; so, an investor’s shares/units, when redeemed, may be worth more or less than their original cost. Verdence relies heavily on unaudited third-party data. Data sources include public data, such as mutual fund data, and non-public data, such as information provided by other investment advisors and managers of limited partnership pooled accounts. Data and/or statistics included on this Portal, including references to performance, opinions, ratings, rankings, manager statistics and demographic information, product, or strategy descriptions, either quantitative or qualitative, are based upon information reasonably available to us as of the applicable date(s) then-published. Information has been obtained from sources that we believe to be reliable, but these sources cannot be guaranteed as to their accuracy or completeness. All data and information produced by a third party has the potential to be incorrect, incomplete, or otherwise misleading. No implication shall be created that the information contained on the Site is correct, including as of any time subsequent to the publish date, and Verdence does not undertake an obligation to update such information at any time after such date. Verdence makes not warranty or representation of the veracity of the data and information and its use of the information should not be implied as an endorsement of any material or statements made. Data, particularly non-public data, is subject to error and where the information is not audited, the potential for error is greater. Where shown, performance information presented is that which has been calculated and presented by an unaffiliated third-party manager. We have no insight into the performance of the advisor/product/account or fund shown and do not attempt to determine whether the performance presented is accurate. Therefore, the performance could be incorrect, overstated or not reflective of actual trading of client funds. There is the potential that the performance shown is a back test and not the result of real investment advice and trading. As such, it could not be relied upon as indicative of future returns of a particular strategy. Where performance shown is that of a pooled account, limited partnership, or private equity fund, you should be aware that there is a significant lack of transparency into the operations and investment process and investment vehicles invested in. As a result, pricing and valuation of the underlying holdings which produced the stated performance could be incorrect, stale, or overstated and therefore the performance figures presented cannot be relied upon. Before investing, we encourage you to request additional information, particularly performance information, of any product that you are considering for your client. You should read, as applicable, the Prospectus, SAI, Composite Disclosure and/or performance disclosure associated with any product that you are considering for investment for your or your client’s. Certain products shown may have account minimums or minimum investment sizes that are unattainable for your clients and therefore they may not be eligible to invest in these products. Reference to registration with the Securities and Exchange Commission (“SEC”) does not imply that the SEC has endorsed or approved the qualifications of Verdence or its respective representatives to provide any advisory services described on the Site.

Read more