
In 3Q23, investors started to accept the reality of the “higher for longer” interest rate regime. The realization that central banks have not yet declared victory in the war on inflation and years of excessive borrowing by global governments fueled a surge in interest rates around the world. As a result, a modest valuation correction began in global equities as investors started to accept the “higher for longer” rhetoric that global central banks have reiterated time and time again. After the best start to a new year in the past four years (through 2Q23), the MSCI AC World Index posted its worst quarterly decline in a year, the 10-year U.S. Treasury yield rose to the highest level seen since 2007, and even Japan’s 10-year Government yield rose to a nine-year high.
While the fourth quarter of a calendar year has typically seen favorable seasonality for equities, we remain cautious. The headwinds the global economy is facing continue to pile up and now we can add an unimaginable geopolitical conflict to the long list of uncertainties for investors. In this quarterly, we will discuss our outlook for the economy in the face of so many challenges and offer our view on portfolio positioning in these highly uncertain times.
Labor Market Not Enough to Avoid Recession
Despite the resiliency of the economy and optimism that the Fed can orchestrate a “soft landing” for the economy, we believe at least a mild recession is unavoidable. Unfortunately, the effects of the most aggressive tightening cycle since the 1980s are starting to filter into the economy. We acknowledge the strength of the labor market has been one of the main drivers that has kept the economy from avoiding a recession thus far; however, the labor market is a lagging indicator, and cracks are emerging. Some of the headwinds for the economy include:
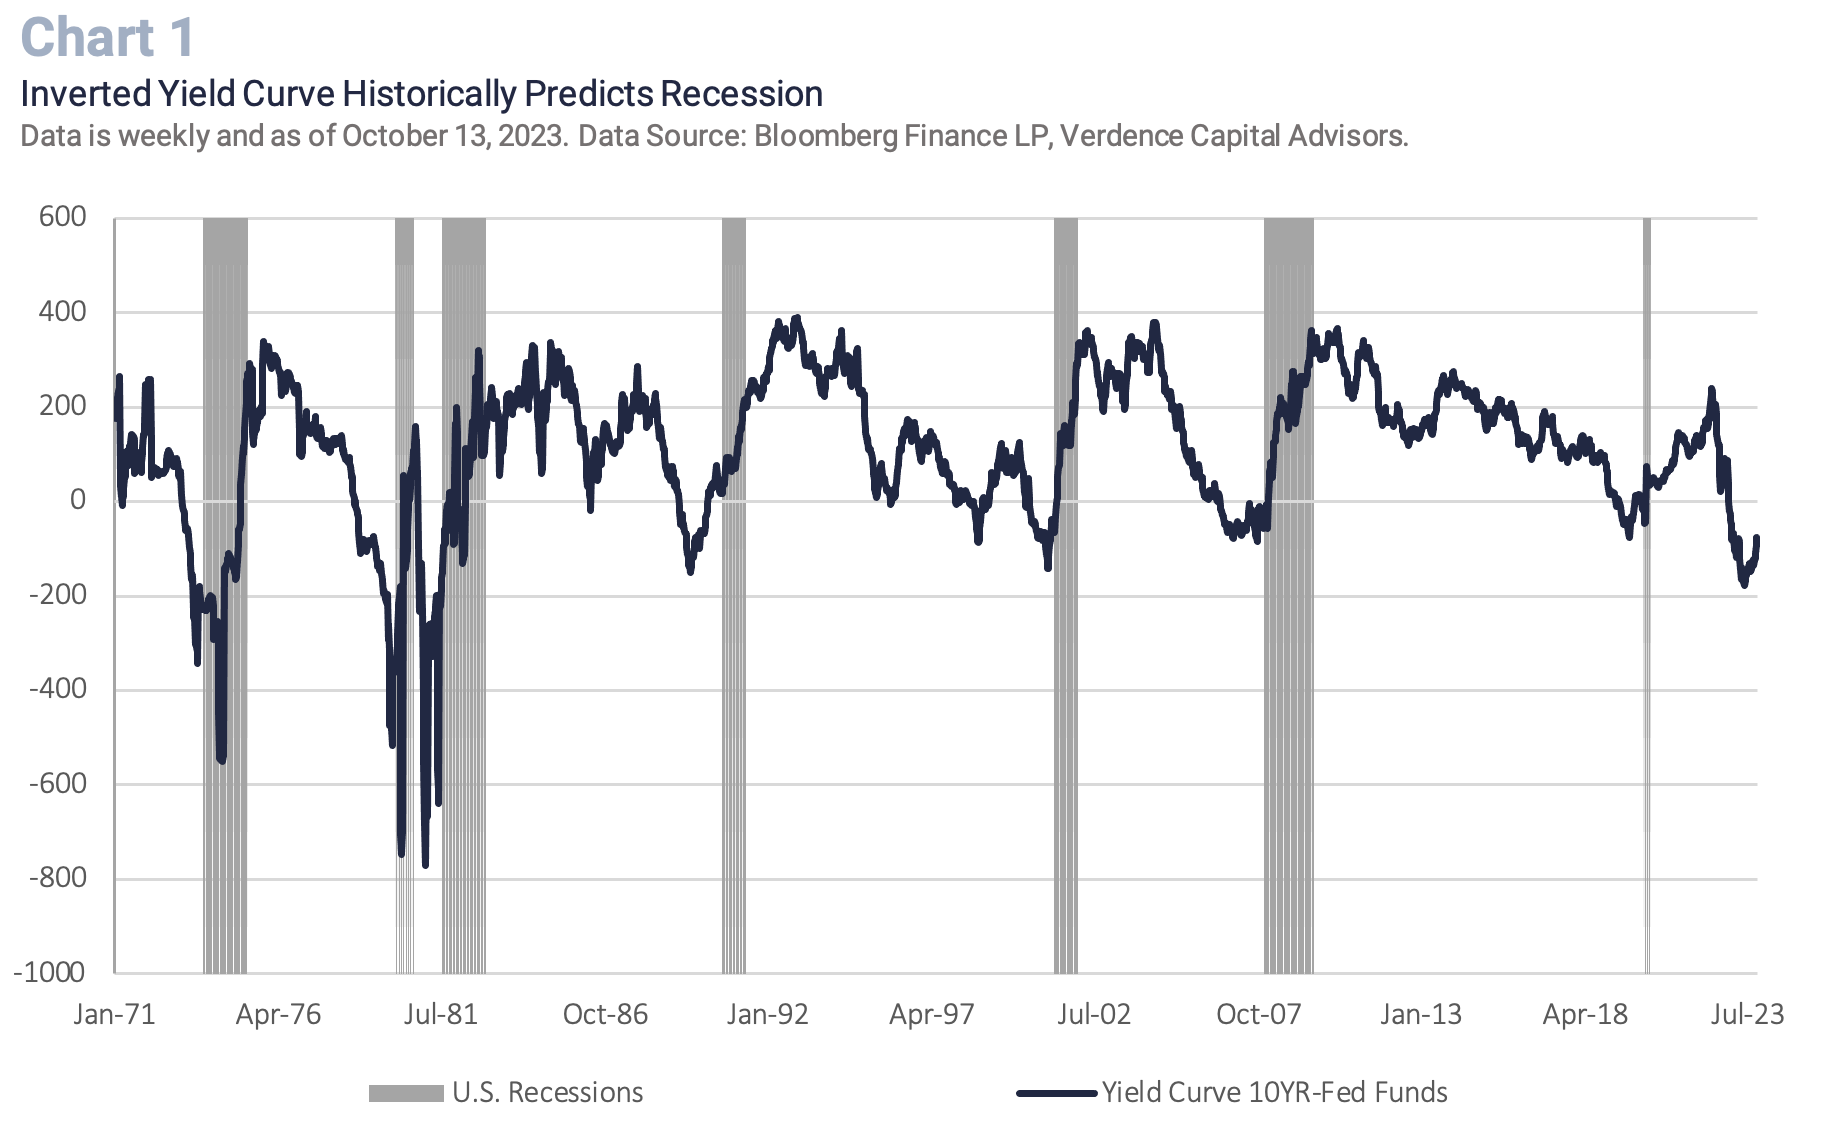
- The yield curve is rarely wrong: Going back to the early 1970s, when the yield curve inverts (10YR Treasury yield minus the Fed funds rate), it has been a leading indicator for a recession in every occurrence except one (when Long Term Capital Management failed in 1998). While the yield curve has started to normalize with the selloff in long-term bonds, it remains deeply inverted. (Chart 1). Historically, when this curve inverts a recession occurs, on average, 11 months later. Since this curve inverted in November 2022, history would suggest a recession as early as this quarter (4Q23).
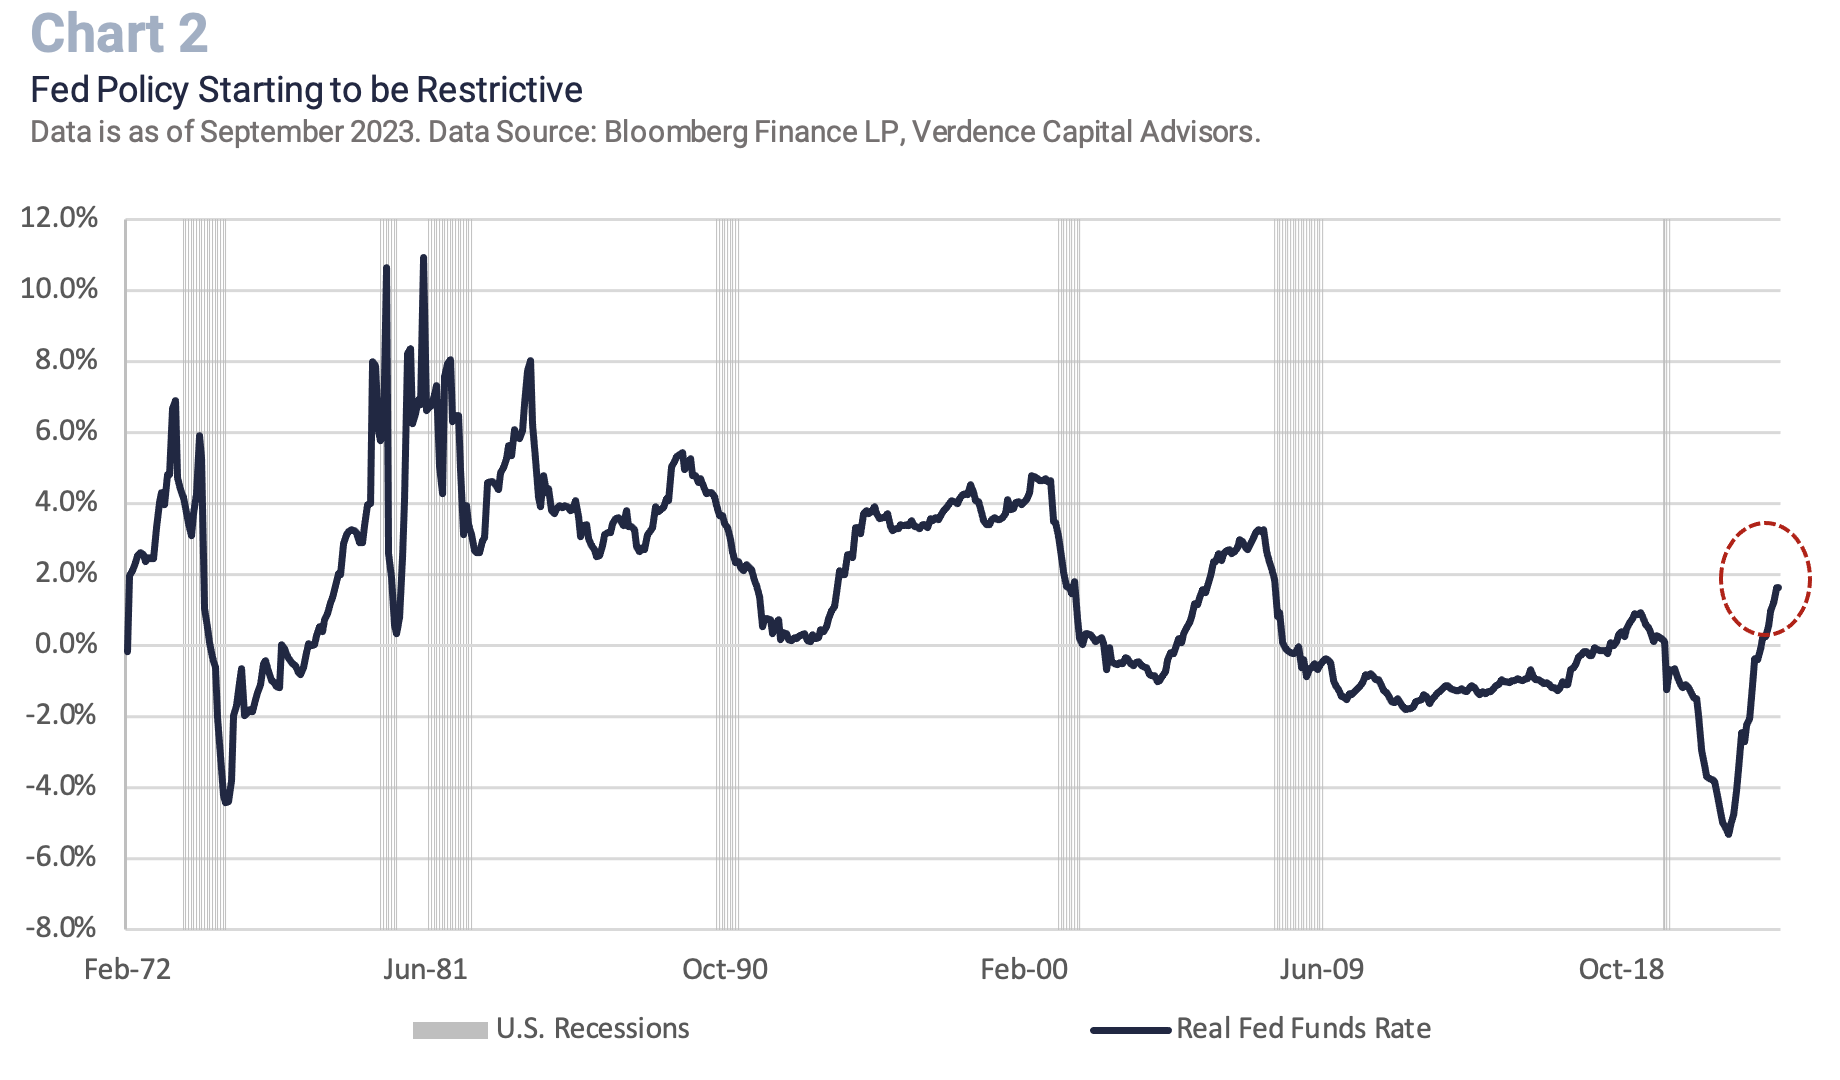
- Monetary policy is just starting to become restrictive: The Fed was behind the curve in the fight against inflation in 2022. As a result, the real Fed funds rate was still in negative territory 12 months after the Fed started hiking and the real Fed funds rate just turned positive in March of this year (Chart 2). While the 525 bps of tightening is starting to be felt in the economy, history shows the real Fed funds rate may need to climb higher to be restrictive enough to officially win the war on inflation. We believe inflation will continue decelerating, but inflation is very easy to reignite, especially if consumers expect easier policy. We think the Fed may have one more rate hike in them before they pause through 1H24 (at least) and assess the economy. However, rate cuts in 2024 will be very difficult to justify if we are still far from the Fed’s target inflation rate. Given the most recent Federal Reserve estimates, the committee does not think they can get to their target rate of inflation (~2%) until 2025/2026.
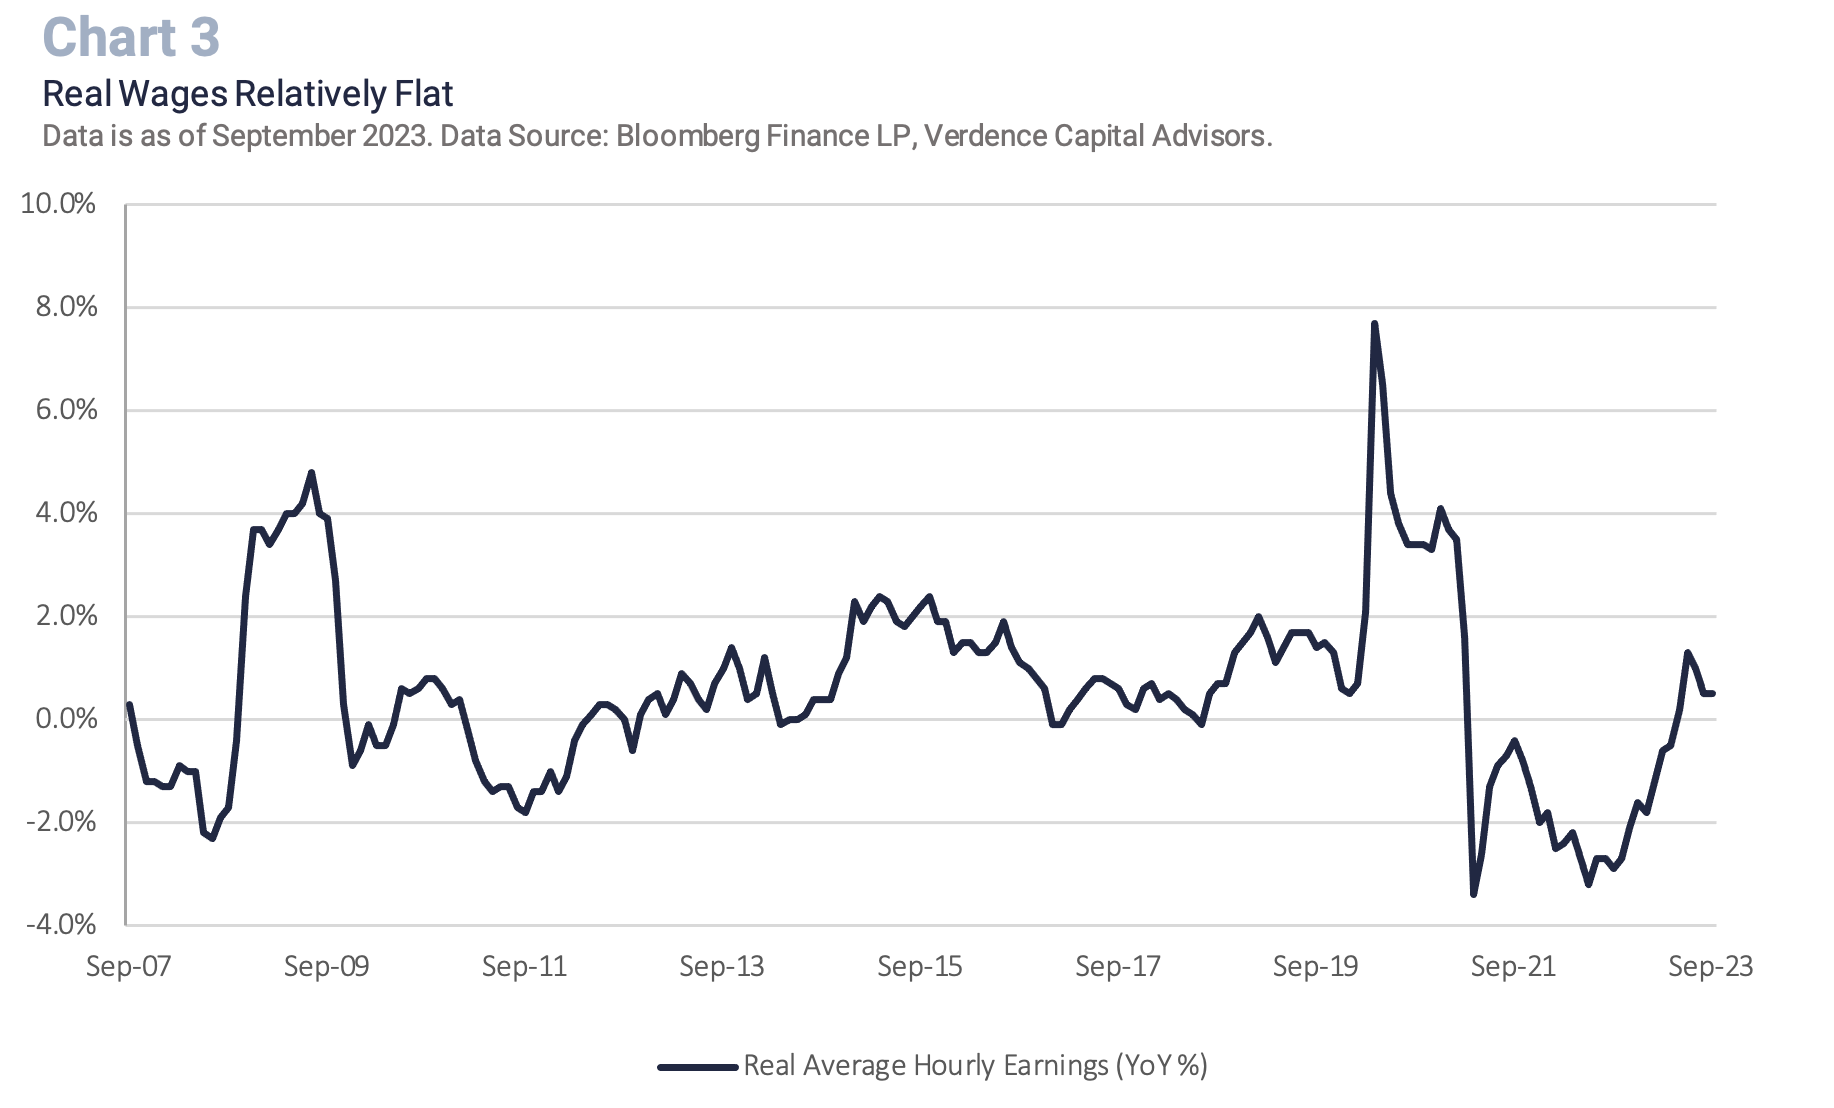
- Consumer spending is unlikely sustainable: The consumer makes up the majority of GDP, and their spending ability has been deeply impeded. Consumers are relying heavily on credit card debt while credit card rates are at record highs. The excessive savings from the pandemic have been wiped out while real wages are relatively flat (Chart 3). In addition, consumer confidence, while already weak, is turning lower in the aftermath of recent geopolitical events, high inflation, and a feeble economic outlook. We have already started to see auto loan and credit card delinquencies moving higher and now personal bankruptcies are accelerating.
- Manufacturing deeply in contraction territory: The manufacturing sector has been in contraction territory (a level below 50) for the past year. There has never been a time since at least 1956 that this Index has been in contraction territory for this long and it has not coincided with a recession.
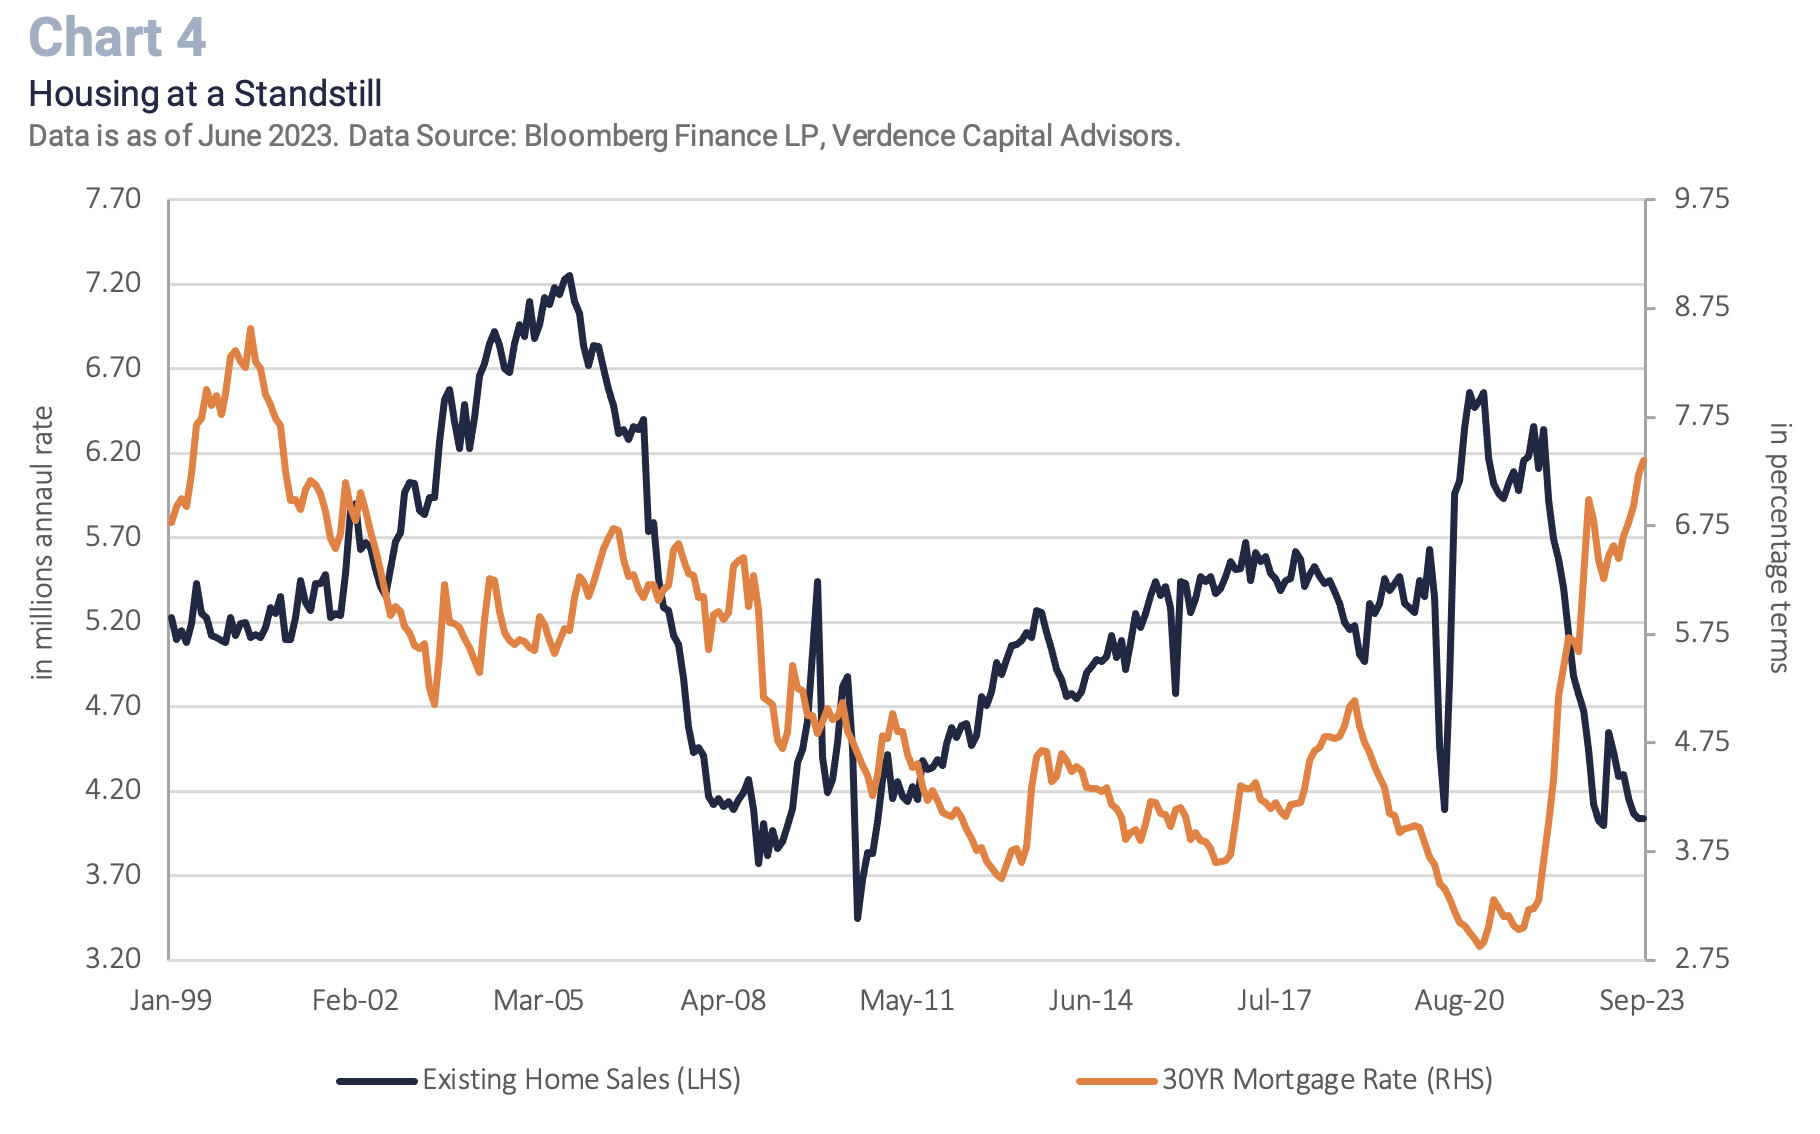
- Housing market in crisis: Housing activity is at a near standstill. Mortgage rates at the highest level since the early 2000s have made Americans less willing to move (Chart 4). As a result, existing home sales are approaching the lowest level since the Great Financial Crisis, homebuyer affordability is at a record low, and homebuilder sentiment is in crisis.
- Tighter lending conditions: As a result of the small and midsize banking crisis earlier this year, banks (both big and small) are tightening lending conditions. Tighter bank lending conditions, alongside restrictive monetary policy, should negatively impact economic growth.
- International growth at a standstill: The U.S. is not immune to a slowdown experienced by its international trading partners. Germany has entered a technical recession (i.e., two consecutive quarters of negative GDP), and broad Eurozone manufacturing is in contraction territory. In addition, China’s economic outlook continues to be uncertain, with targeted stimulus having little impact and real estate an ongoing risk.
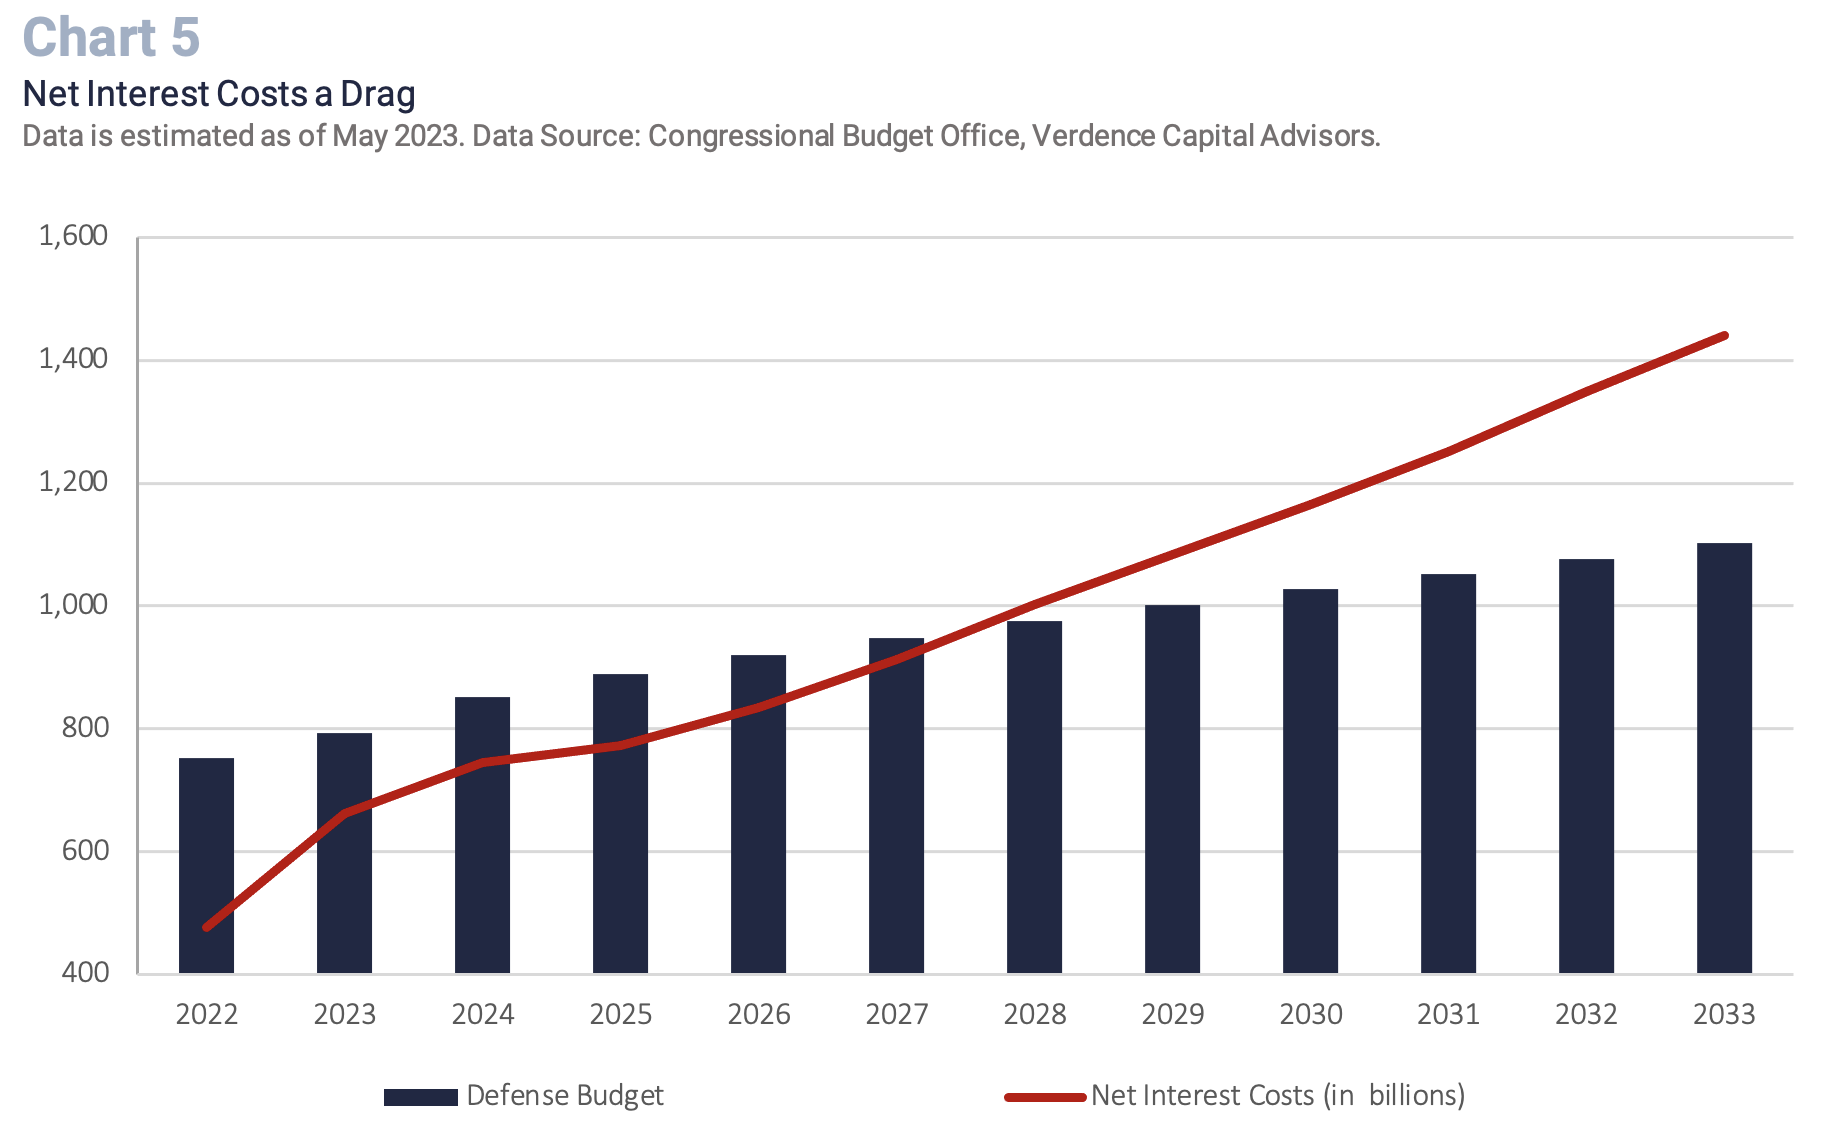
- Budget deficit a headwind: The U.S. budget deficit is becoming a major economic headwind. The U.S. has been able to spend relentlessly in the low-interest rate environment of the past couple of decades. However, with rates higher, funding the deficit is becoming a strain on the U.S. budget and, ultimately, on the economy. According to the Congressional Budget Office, net interest costs to fund our debt are expected to exceed the amount of money we spend on defense by 2028. (Chart 5).
- Cracks in the labor market emerging: There are some structural challenges in the labor market that are keeping the unemployment rate low despite weaker economic fundamentals (e.g., demographics, immigration). However, history tells us that the labor market is a lagging indicator. Going back to all the recessions since 1953, the unemployment rate bottoms, on average, two months before the recession starts. It peaks, on average, three months after the recession ends. Employers wait until the economy is heading toward a recession before they cut workers. In fact, one thing they will do first is start cutting the workweek and reducing temporary workers, both we have seen materializing in recent months.
While history does not always repeat itself, it often rhymes. There are too many headwinds stacking up against the economy and we have not even fully touched areas in distress like commercial real estate. We are not calling for a calamitous recession but do see at least a short and shallow recession as unavoidable and even healthy so that we can officially get inflation in check and move on to the next economic expansion. While we applaud the resiliency of the economy this year, even the U.S. economy has its limitations. Especially when it does not have the Federal Reserve to come in at the first sign of weakness to save the economy.
Global Equities – Valuations Still at Risk
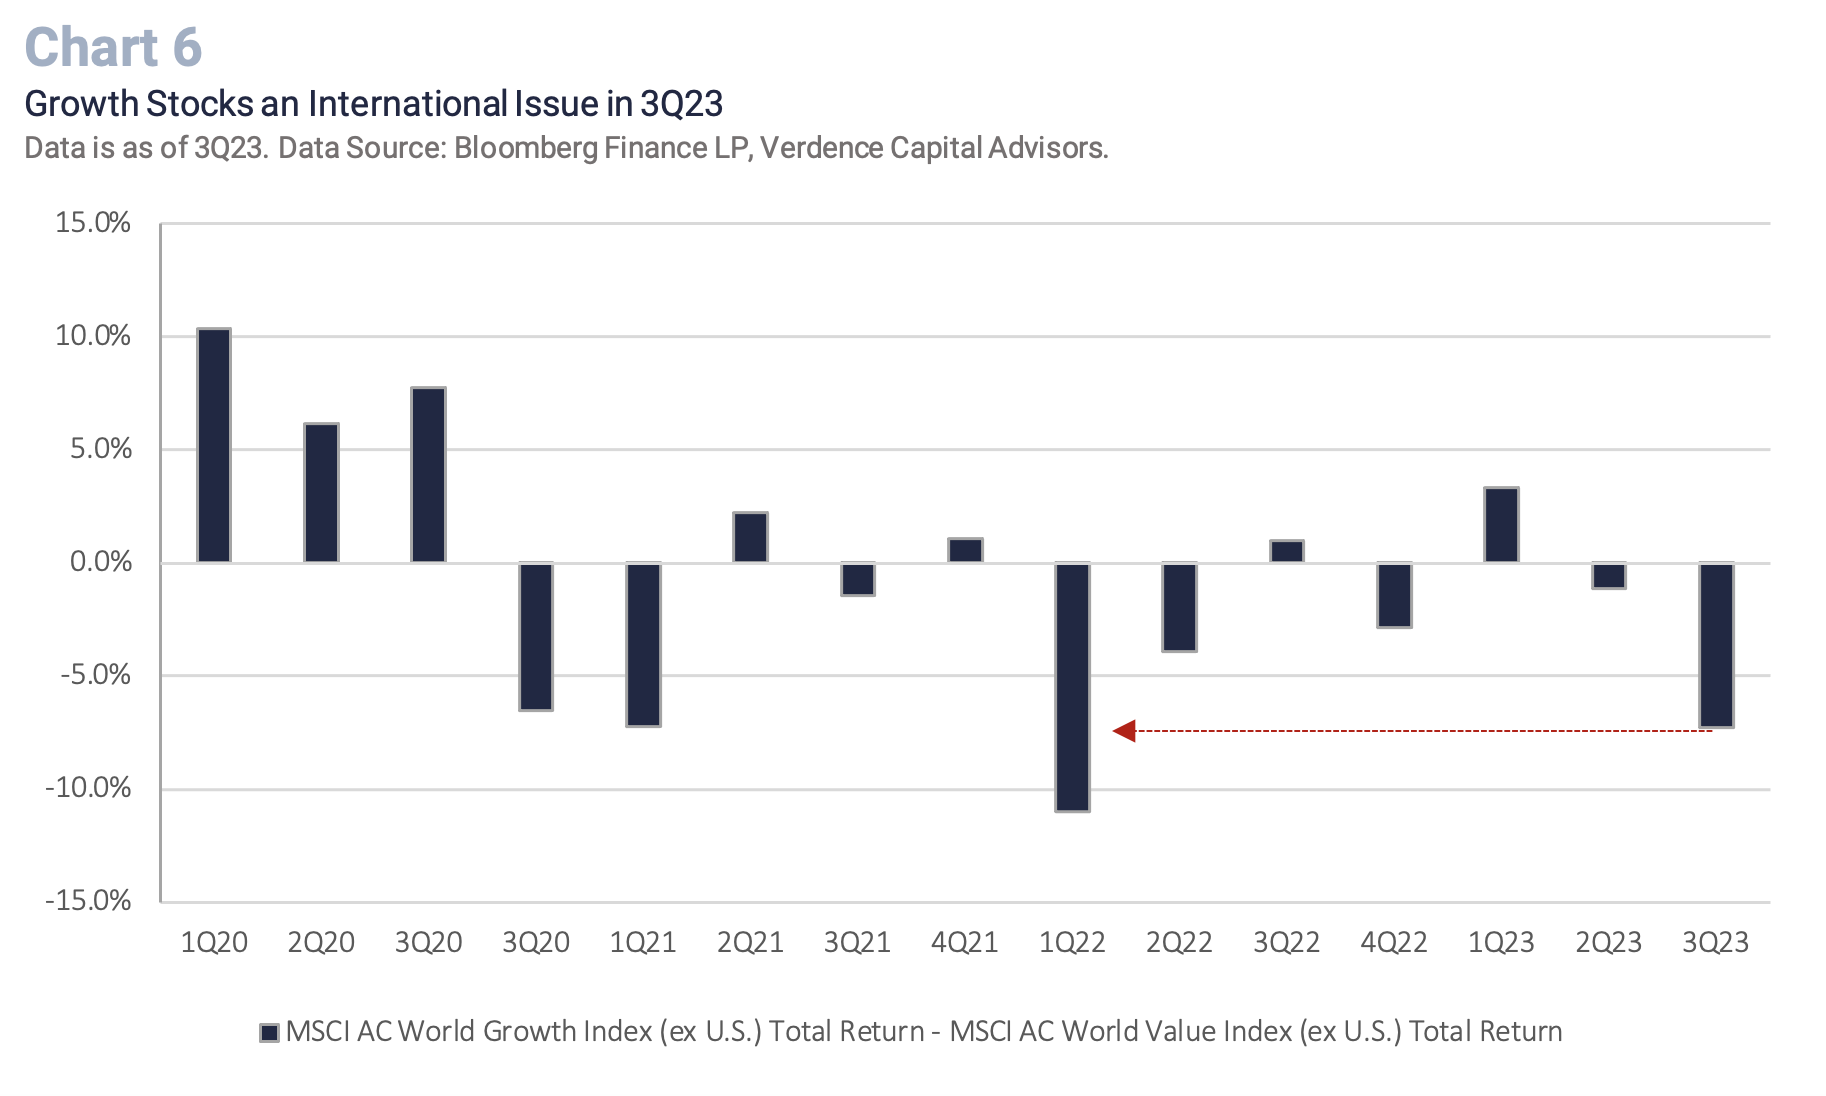
In 3Q23, global equities were jolted back to the reality that interest rates are going to stay higher for longer. The surge in bond yields caused the high price to earnings multiple sectors to suffer (e.g., technology, growth). The NASDAQ posted its worst quarter in the past five quarters and the Russell 1000 Growth Index its worst in four quarters. The correction was felt internationally as well with the MSCI AC World Growth Index (excluding the U.S.) underperforming its value counterpart by the most since 1Q22. (Chart 6).
While there are signs the U.S. earnings recession may be coming to an end, we still do not think that global equities are fully pricing in the “higher for longer” interest rate regime that is not just a U.S. story but an international one. In addition, there is too much optimism in equities that central banks can orchestrate a “soft landing” and the expansion can continue indefinitely. As a result, we remain cautious on global equities and maintain a neutral allocation compared to our benchmark for the following reasons:
- The equity rally is still too concentrated: The “magnificent 7” (i.e., Apple, Microsoft, Alphabet, Amazon, NVIDIA, Meta Platforms and Tesla) has made the S&P 500 even more concentrated. Through 3Q23, the “magnificent 7” have made up ~85% of the S&P 500 total return for the year. In fact, through 3Q23, 50% of the S&P 500 companies were negative year to date, by on average, ~15%.
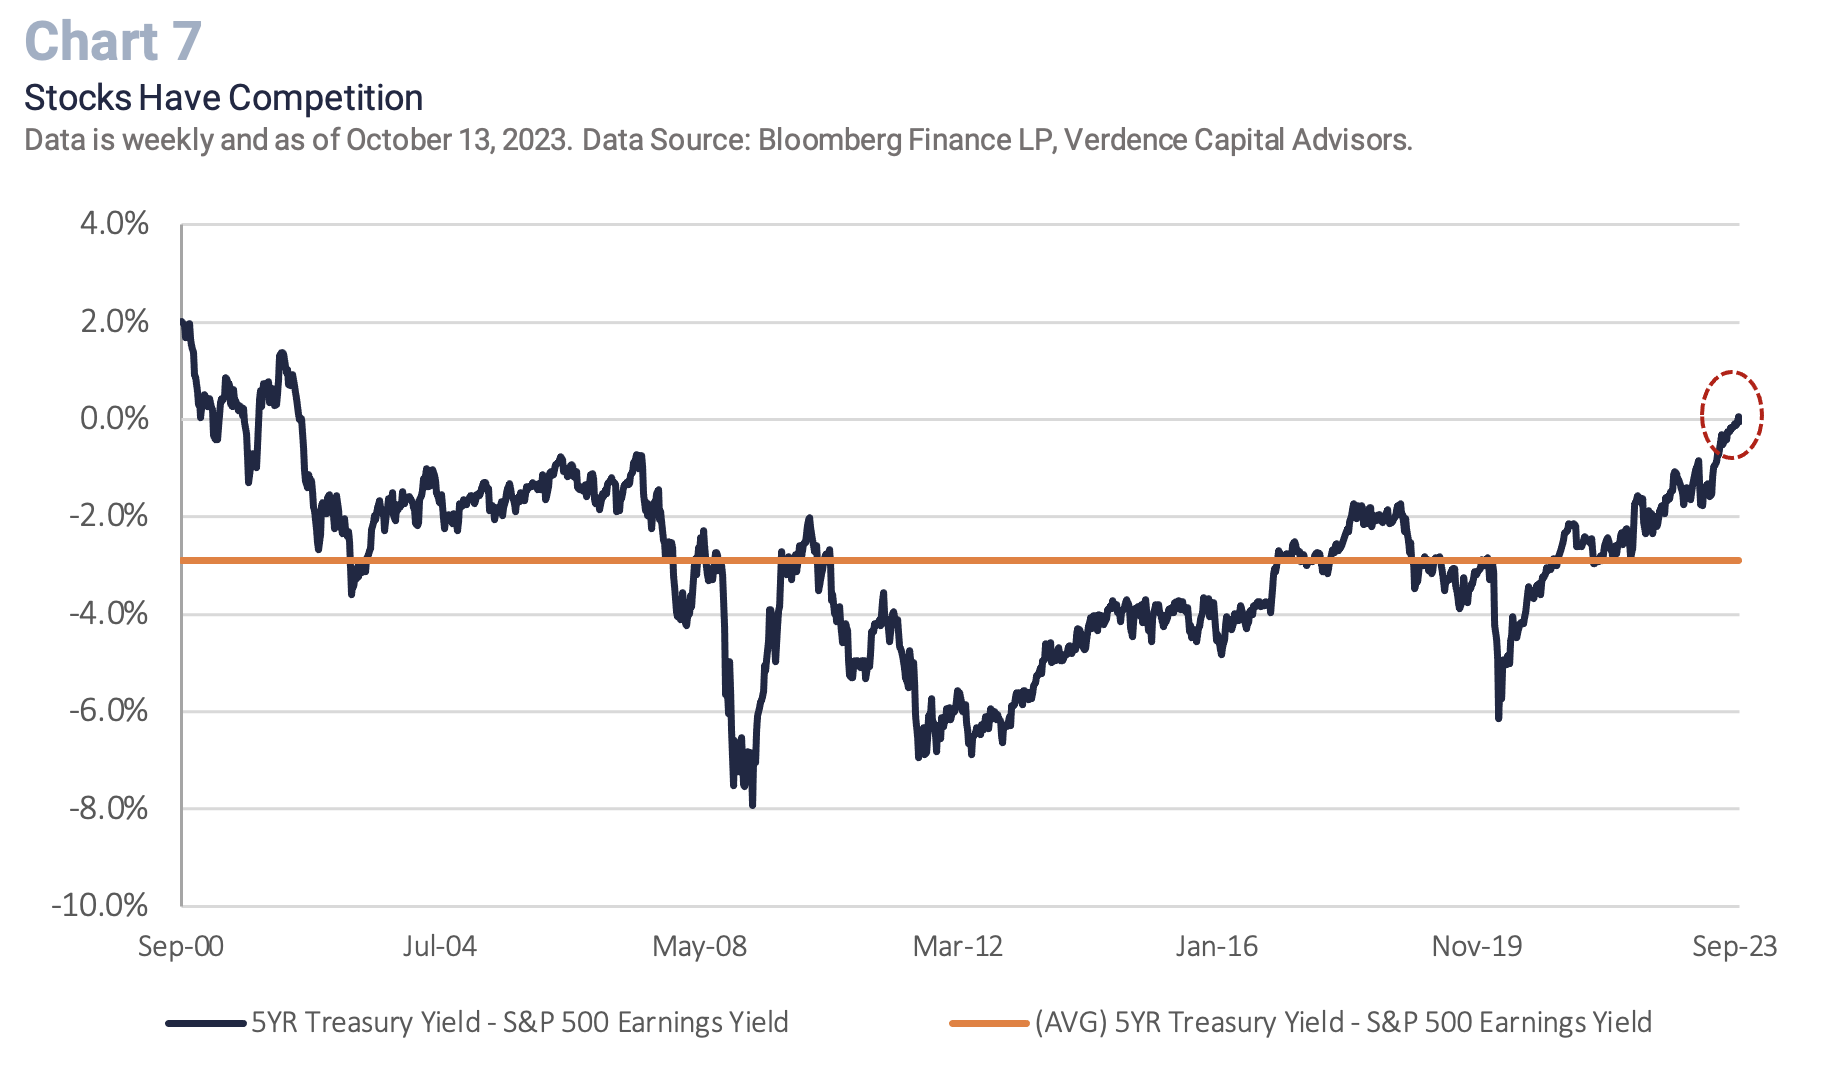
- Equities have competition: The surge in bond yields has resulted in something that we have not witnessed in over 20 years. There IS an alternative to equities. The term TINA (i.e., There is no Alternative) was coined after the Great Financial Crisis as the Fed kept interest rates near historic lows and its balance sheet at record highs. This pushed investors to equities as bonds offered no alternative with historically low yields. However, bond yields are now offering attractive opportunities for investors, especially in the short and intermediate maturity range. For example, the difference between the five-year Treasury yield and the S&P 500 earnings yield just turned positive for the first time since 2002. (Chart 7).
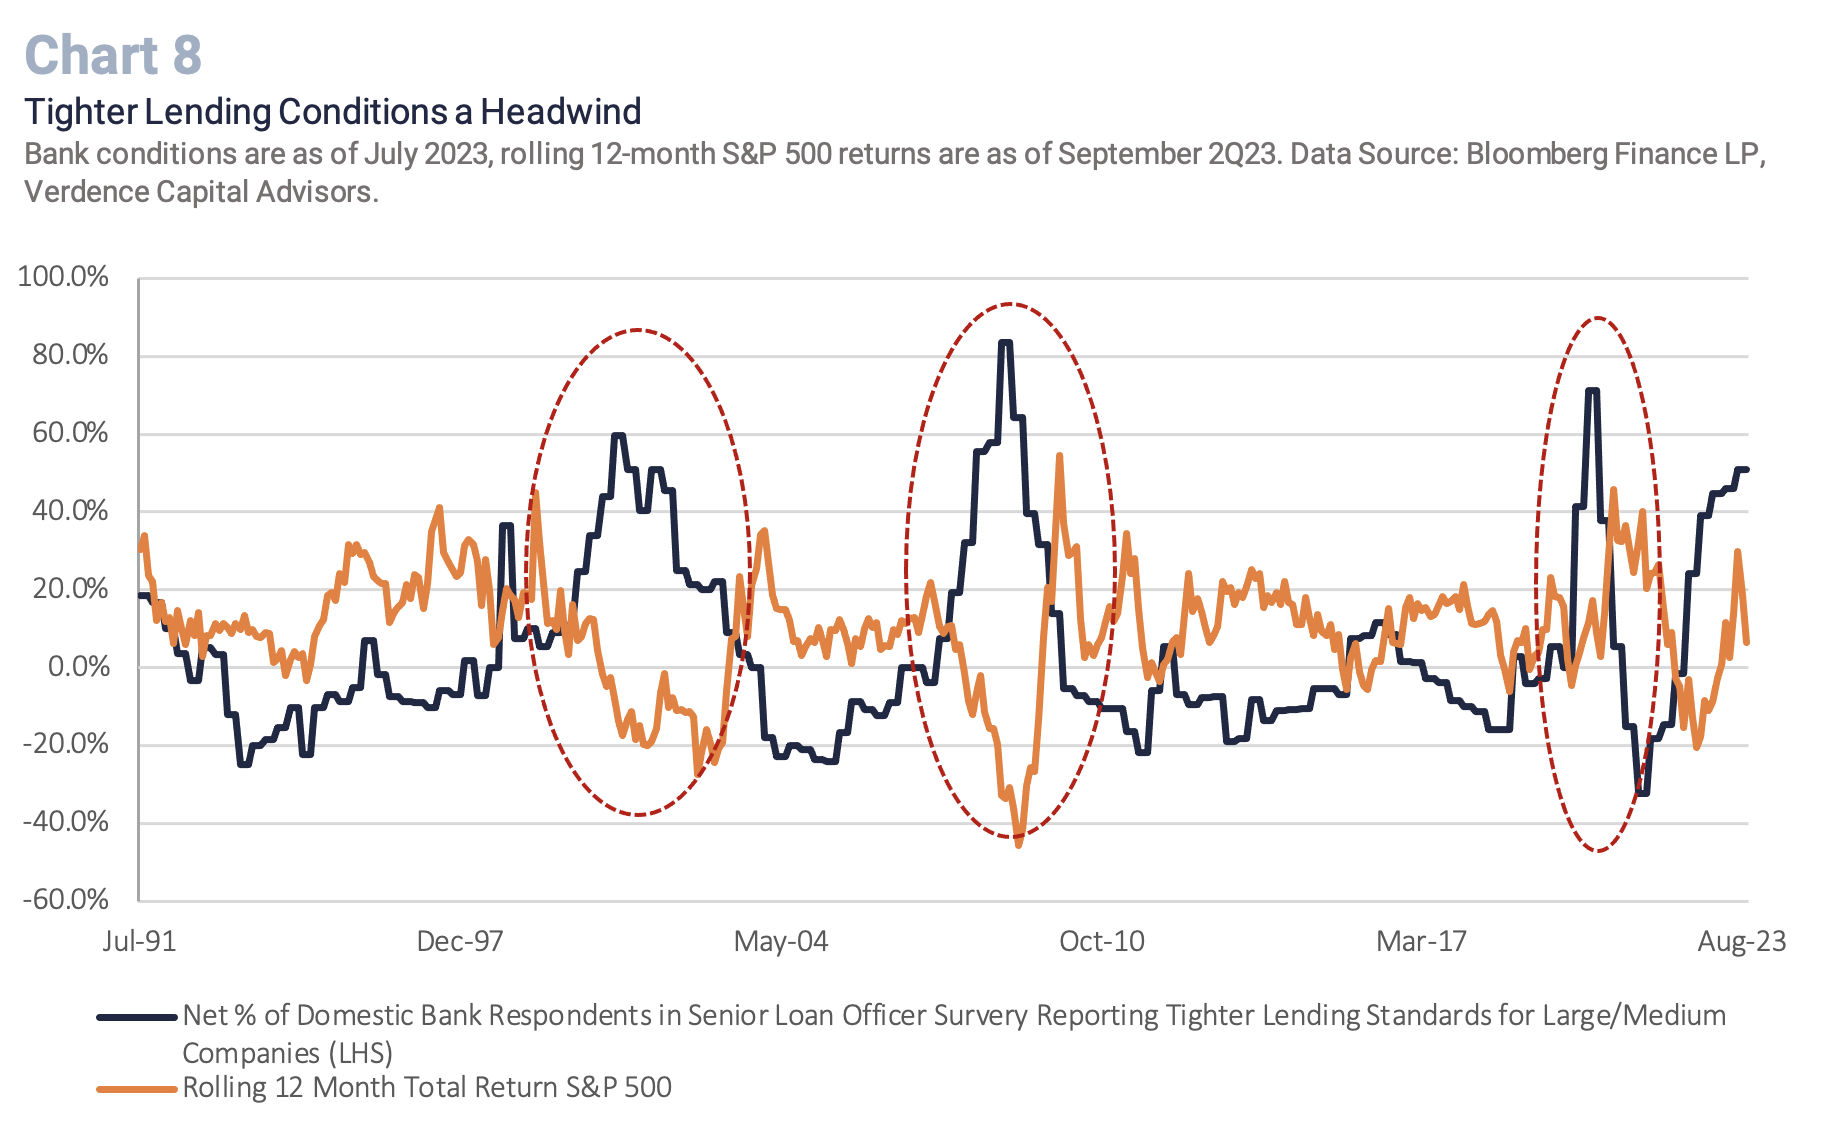
- Economy does not warrant an overweight: While equity investors are typically forward-looking, we think equities at current levels may be overstating the probability that the Fed can orchestrate a soft landing. Economic leading indicators are deeply in negative territory and historically have been correlated with weak equity returns. In addition, banks continue to tighten lending conditions which have historically challenged equity returns. (Chart 8). Lastly, going back to all the recessions since 1929, the S&P 500 has never bottomed before a recession begins. Since we believe a recession is likely over the next 12 months that leaves additional downside for equities.
While we favor equities over bonds for the long run, currently we remain cautious. While select regions are attractive compared to the U.S. on a valuation basis (e.g., developed international) we think there are too many risks that can result in a broad “risk off” sentiment and global equities are still highly correlated. One of our biggest concerns is the complacency around interest rate policy and what the Fed can and cannot do when the economy begins to turn. In addition, the Fed is reducing its balance sheet in an unprecedented manner which will likely tighten monetary conditions further.
Fixed Income – The End of an Era
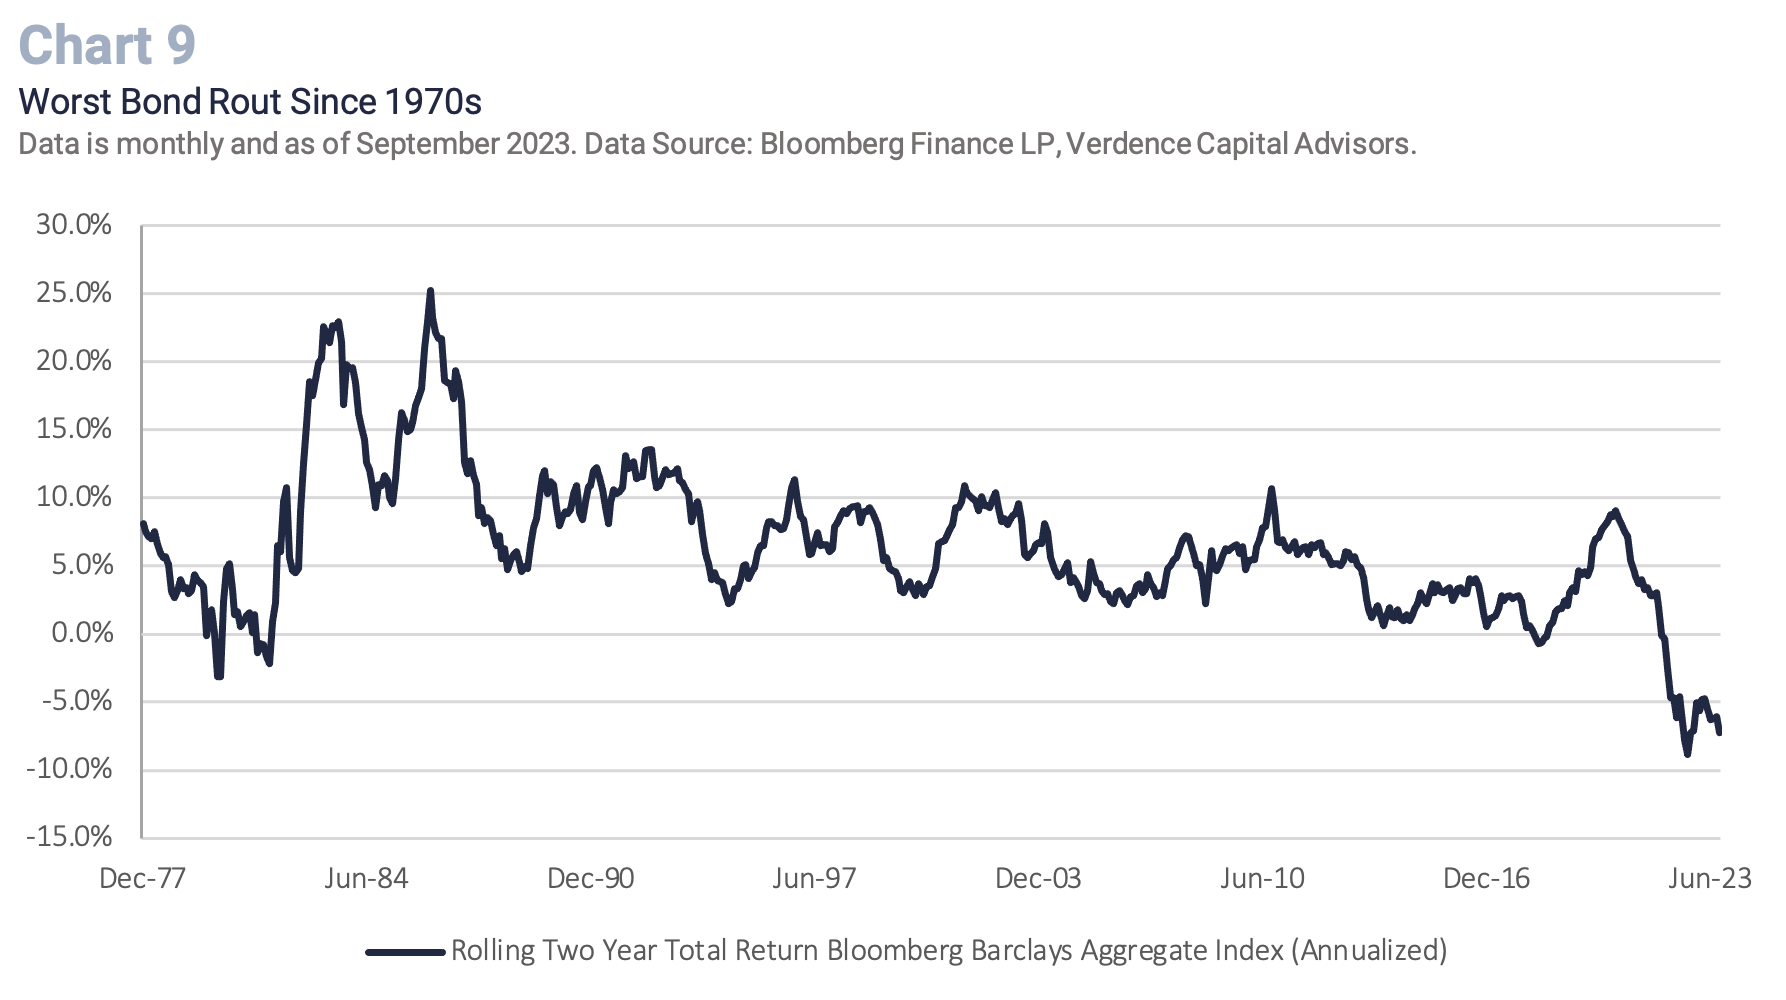
Bond investors are experiencing the worst period for bonds since at least the 1970s. (Chart 9). Persistent inflationary pressures, a Federal Reserve that is trying to reduce its balance sheet, a surge in Treasury issuance and lackluster global demand at Treasury auctions continue to push rates higher. Fortunately, the rise in yields is also presenting attractive risk-adjusted opportunities that investors have not seen in decades. While we still favor cash given the inversion of the yield curve and anticipation the Fed will keep rates higher for longer, we offer the following considerations in fixed income.
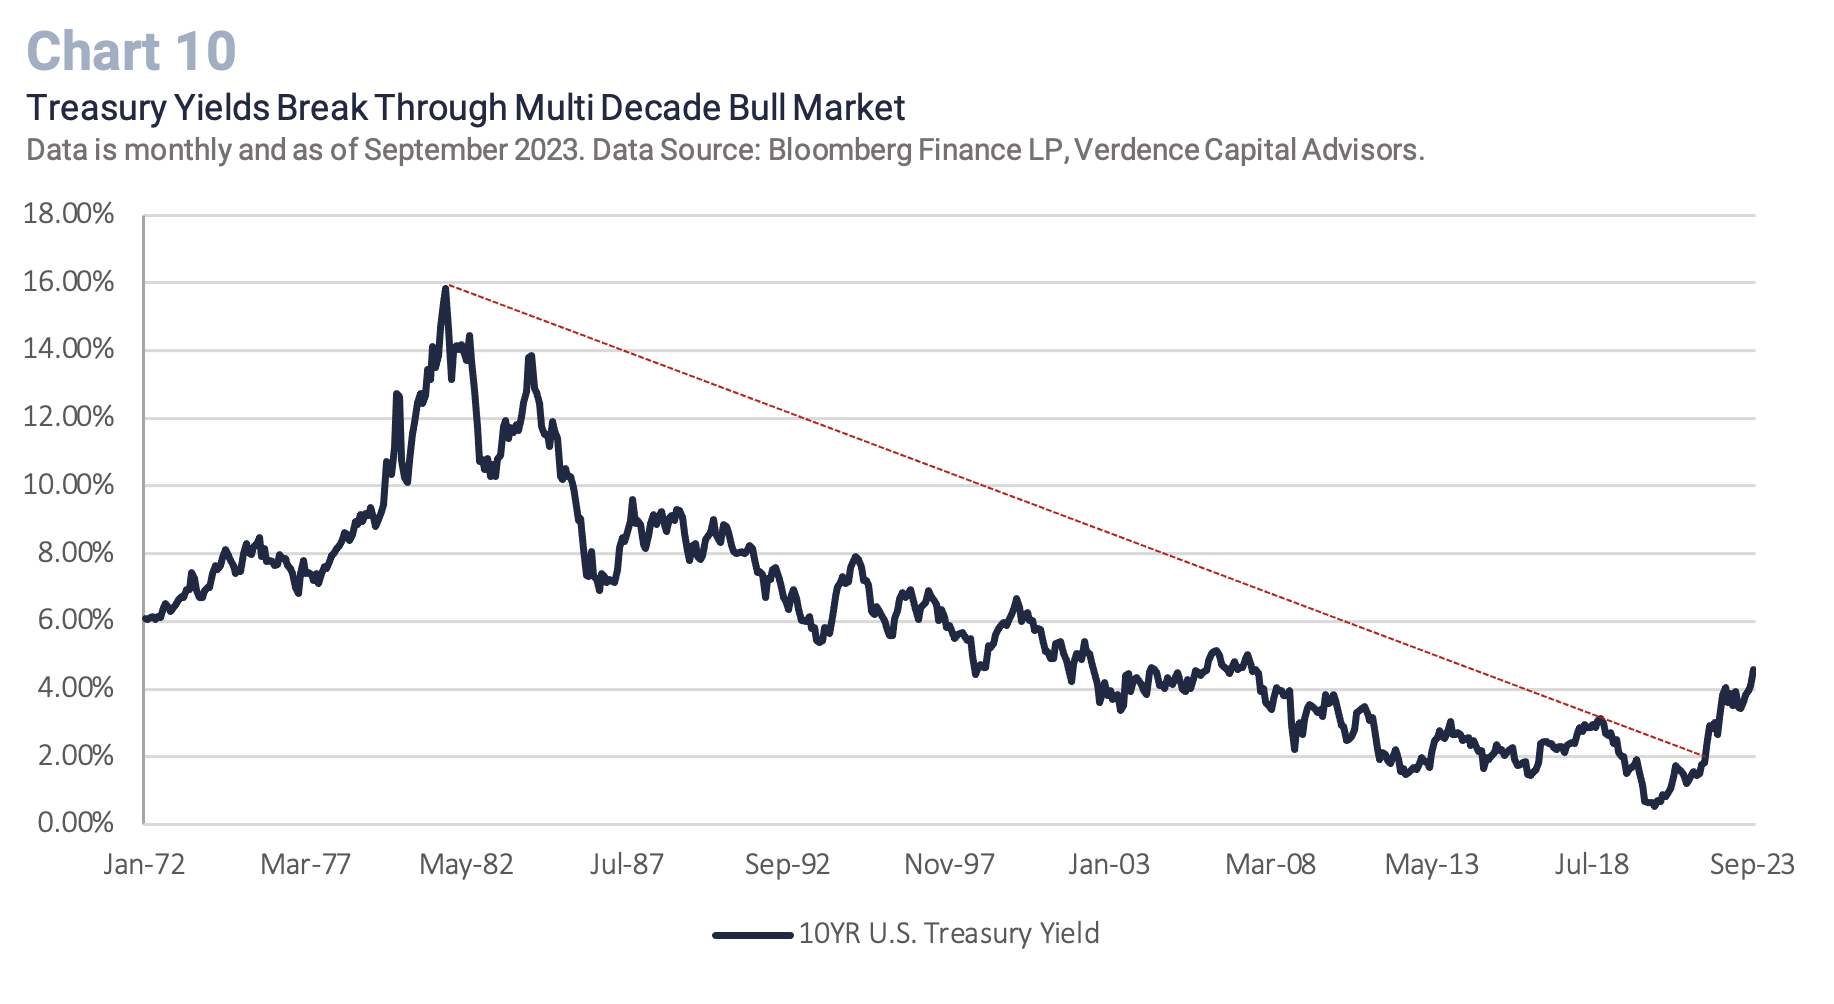
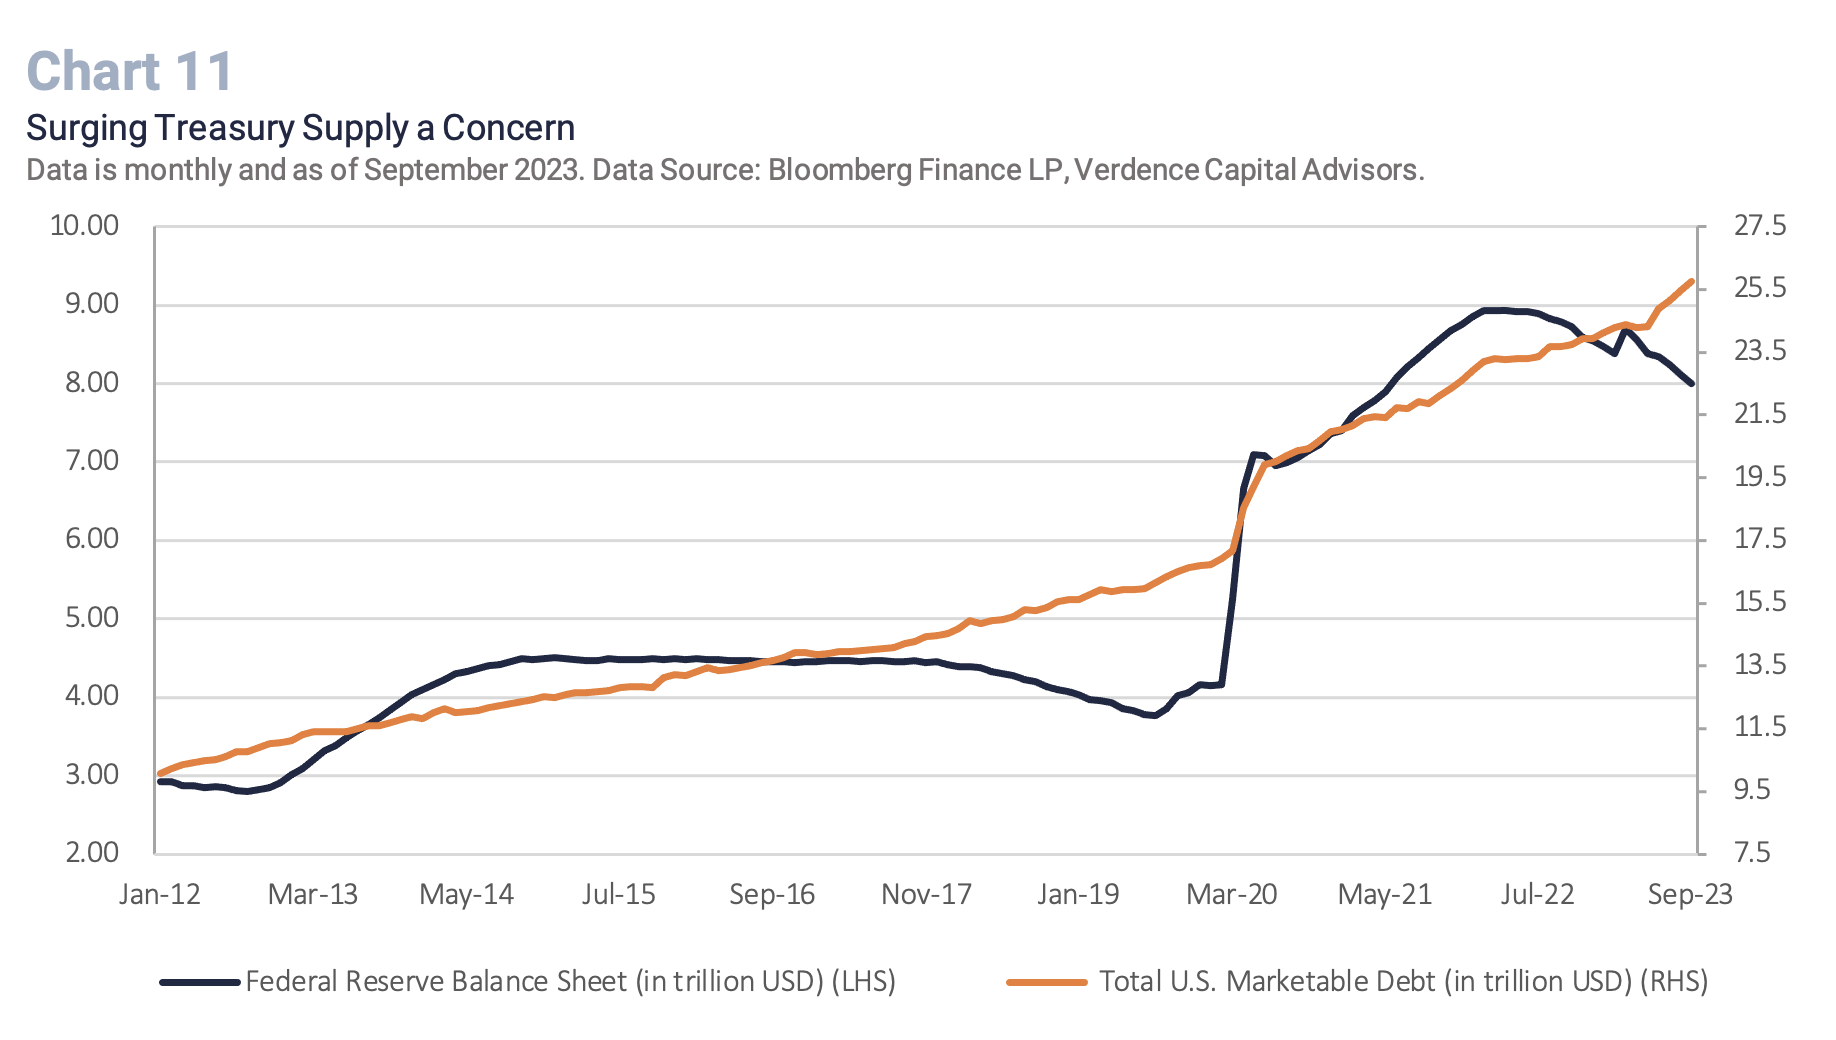
- Neutral duration, not long: Long-term bond yields (10YR Treasury) have broken out of a multi-decade long bull market (yields rise and prices go down) (Chart 10). Therefore, moving some fixed income allocation to intermediate maturing bonds may offer both attractive coupons and potential price appreciation as economic growth slows. We do not recommend investing in long-term bonds at this point despite our outlook for the economy. The Federal Reserve has been the largest holder of U.S. Treasury debt for years and is starting the unprecedented exercise of reducing its balance sheet (i.e., quantitative tightening) to further tighten monetary policy. This is occurring while the swelling fiscal deficit has caused the Treasury supply to surge. (Chart 11 ). In addition, the U.S. is not the only country offering yield. International developed markets that dealt with a negative interest rate policy for years are also now offering clients yield with no currency risk. Therefore, we have also seen weakness in demand for Treasuries from global buyers.
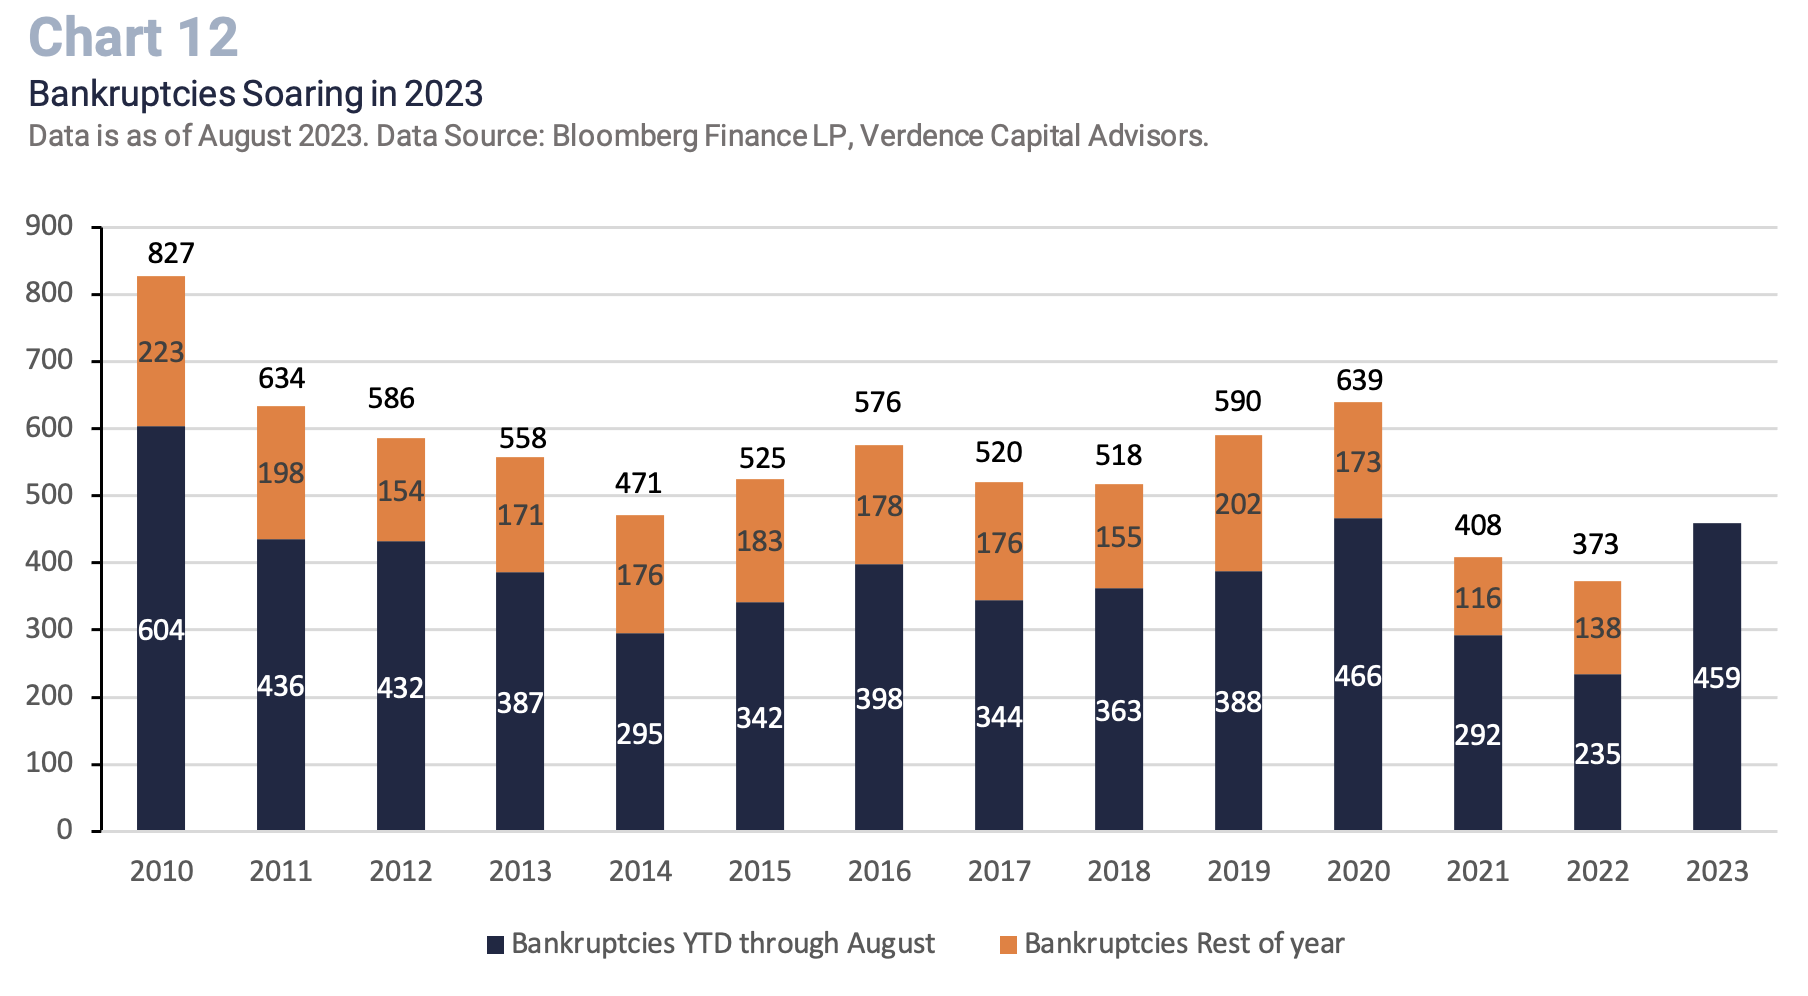
- Credit still not attractive: Despite the absolute yield on high yield and investment grade bonds looking attractive (e.g., 6.3% and 9.2%, respectively)1 the extra yield investors are earning to take on the credit risk over the safety of Treasuries (i.e., spreads) is still too tight. Historically, in every economic slowdown and/or recession, spreads widen and that has tended to be the best opportunity to buy corporate debt. In addition, we think corporate debt is expensive given the expected economic downturn, higher interest rates and likely pick up in corporate defaults over the next 12 months. In fact, bankruptcies are piling up this year as refinancing debt is problematic for companies in this high interest rate environment. Through August, there have been 459 U.S. bankruptcies, which has exceeded both 2021 and 2022 (Chart 12).
With yields rising, bonds are offering some attractive opportunities. Bonds have historically offered an attractive return when the economic outlook deteriorates (yields fall, prices rise). We will continue to monitor the economic outlook and adjust duration if necessary. However, there is too much of a supply/demand imbalance and liquidity concerns in long-term bonds currently, so we lean toward an intermediate duration in portfolios. We are also anxiously awaiting an opportunity to invest in corporate bonds. Historically, corporate bonds offer good returns when investors are compensated for the extra risk (e.g., spreads widen).
Alternatives – Diversify in an Economic Downturn
For qualified investors, alternative investments can perform well in periods of economic uncertainty and even periods of tighter lending conditions. On the private side, managers have more flexibility and time to be able to find and make good long-term investments. Clients that invest in private investments, are spared the daily volatility seen in public markets and historically have been offered an uncorrelated asset with robust risk-adjusted return. Sectors in the private alternative space that we favor include:
- Low-volatility hedge funds can offer another layer of diversification, add return potential, and serve as a hedge for investors’ public market equity exposure.
- Real assets offer a low correlation to other asset classes, diversification and in some cases an inflation hedge. We would focus on real asset investments like infrastructure, land and select opportunities in the real estate space (e.g., flex industrial and multi-family).
- Private credit: The publicly traded corporate bond market is unrealistic about the upcoming economic downturn. In addition, with small and mid-sized banks having less ability to lend, sources in the private market may benefit (e.g., private credit managers). Due diligence is crucial in this space, especially as defaults are likely to rise and demand for credit in the private space has been strong.
One area of the alternative market that we are looking for as an opportunity this year is the commodity space. Typically, commodities fall after the economy has already turned. Past recessions have offered good opportunities to enter this space. In addition, we have not solved the energy shortage and/or food shortage around the world so commodities have the potential to represent a good long-term investment.
The Bottom Line
In these times of heightened uncertainty with the economy, geopolitical events, and higher interest rates we realize it can be unsettling for investors. However, it is important to remember that recessions and pullbacks in equities are healthy and normal. From an economic perspective, recessions are part of all economic cycles. This cycle is particularly important for the Federal Reserve to continue to keep monetary conditions tight so as to not reignite inflation. We do not want a recurrence of the 1970s and 1980s when stop-and-go monetary policy resulted in more frequent recessions and decades of stagnant equity returns. Instead, the recession we expect will be a Fed led recession to clear out the excesses and distortions that are still lingering years after the pandemic. The equity rally we have seen this year is not reflecting our base case scenario that interest rates are going to stay higher for longer and the economy will experience a downturn. As a result, we still think cash is the key to success at this stage in the cycle. Having dry powder and liquidity will offer us the chance to act swiftly if and when valuations are more realistic, and the economy looks to emerge from the downturn.
If you have any questions or comments, please reach out to your financial advisor.
Megan Horneman | Chief Investment Officer | [email protected] Past performance is not indicative of future returns
1 As of October 17, 2023.