WEEKLY INSIGHTS

June 16, 2025
Download PDF

Key Takeaways:

  • Price Stability – one of the two dual mandates from the Fed.
  • Shelter costs remain stubborn.
  • Egg prices lower for second straight month, still ~42% higher from a year ago.
  • Isolated tariff-related price increases from CPI data.
  • Not out of the woods yet on inflation; tariff-related price increase may come later.
  • Fed to keep rates unchanged but SEP data more important.

The Fed’s Other Mandate – Price Stability

In last week’s edition of our Weekly Insights, we dove into the health of the labor market given that maximum employment is one of the Fed’s dual mandates. In this Weekly Insights, we wanted to examine the other side of the Fed’s dual mandate: inflation. We will evaluate the current state of inflation, offer insight into whether we are seeing tariffs show up in inflation data, and examine what the current inflation environment may mean for the Fed’s meeting this week.

Data may be hiding underlying risks:
  • In May, the headline Consumer Price Index increased slightly less than expected (+2.4% year-over-year) and is approaching the Fed’s 2.0% target. In addition, the three-month rolling average of headline inflation is sitting at its lowest level since March 2021 (+2.37% YoY). When looking at core prices (which excludes volatile food and energy prices) they increased 2.8% YoY. The three-month rolling average of the core reading is sitting at its lowest since April 2021 (+2.78% YoY). Looking at the underlying components there is evidence that inflation is sticky (e.g., housing, services).
Inflation still a burden on necessity items:
  • In May, shelter costs increased 3.9% YoY which is ~ 1.0% above the average annual rise we witnessed in the 30 years prior to the pandemic (+3.0% YoY). Construction costs, specifically higher prices for building materials, have fueled the rise in shelter costs. Food prices increased 2.9% YoY, only marginally higher than the 30YR average (2.8% YoY). However, egg prices contributed the most to upward pressure on the index, increasing ~42% YoY, substantially higher than the 30YR average (~5.5% YoY).
Services prices:
  • Services prices within the CPI Index are growing 3.7% YoY which is nearly double what the average 30 years pre-pandemic showed (2.2% YoY). The U.S. is a service-based economy and nearly 78% of GDP is attributed to services. Average hourly earnings, on an annualized basis, have fallen in five of the last six months to ~3.9% YoY (from +4.15% YoY in November ’24). Should services prices continue to rise consumers may need to adjust their spending patterns here.
Tariff impact:
  • There was isolated evidence of tariff-related price increases in the data. Prices for major appliances, including refrigerators, washers/dryers, etc., increased at the fastest monthly pace since August 2020 (4.3%). The monthly advance led to higher year-over-year prices for this category for the first time since October 2022. Additionally, toy prices increased at the fastest monthly pace since February 2023 (1.3%), leading to a year-over-year increase in prices for the first time since June 2023.
LISTEN NOW: Markets With Megan

The Bottom Line

We anticipate the Fed will keep interest rates unchanged at their meeting on Wednesday, but future meetings will be “live”, referring to the possibility for rate changes in the future. The geopolitical landscape remains highly uncertain as well, which could put upward pressure on inflation in the coming months. We will also be analyzing the SEP closely for any changes to future expectations, specifically as it relates to inflation and growth projections.1

Your Economic and Market Detailed Recaps

  • Small business optimism improves for first time this year.
  • Inflationary pressures ease further.
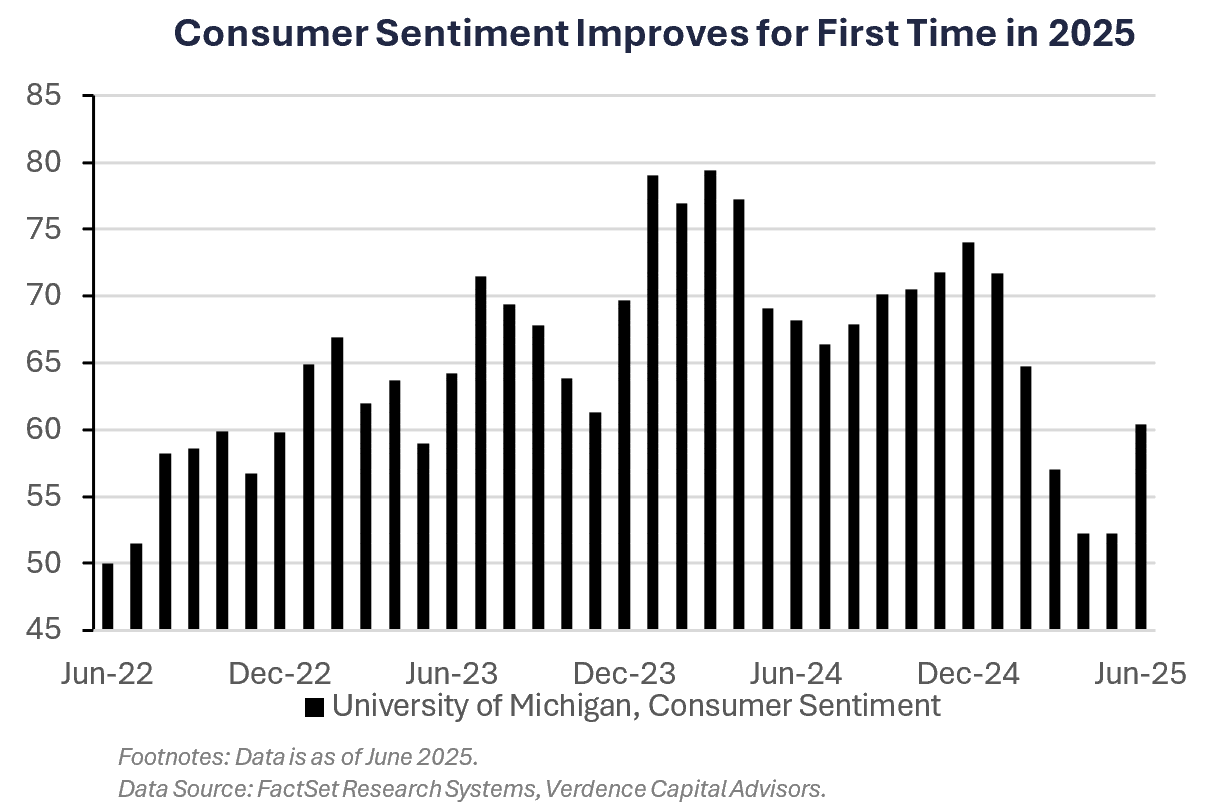
  • Consumer sentiment improves for first time in six months.
  • Global equities fall as geopolitical tensions rise.
  • Yields fall as investors digest economic data.
  • Crude oil prices surge as Israel launches attack on Iran.

Weekly Economic Recap — Inflation Softens but Risks Still Remain

Small business owner optimism improved for the first time in 2025 in May according to the NFIB Small Business Index. Seven of the survey’s ten components improved in May, led by better expectations for business conditions. There was still some weakness, however, as a net 31% of respondents said they plan to raise prices in the next three months, the most in over a year, amid tariff concerns.

Consumer prices increased less than expected in may (2.4% YoY vs. 2.5% YoY est.). Continued weakness in energy prices helped offset higher prices from food and shelter components particularly. Core CPI, which strips out volatile food and energy prices, was unchanged from the prior two months, increasing 2.8% YoY.

Producer prices remained muted in May as the Producer Price Index increased only 0.1% from the prior month. Goods prices excluding food and energy increased 0.2% for the month and contained signs of possible tariff-related price increases, including the largest increase in consumer durable goods since January 2023.

Continuing claims for unemployment benefits increased to the highest since the end of 2021(1.96 million), suggesting it is taking unemployed Americans longer to find a new job. The data is seen as volatile as it includes Memorial Day and the start of summer school breaks in some states.

WATCH NOW: Alternate View Podcast

Consumer sentiment improved for the first time in six months according to the University of Michigan sentiment index. An increase in both short and long-term expected business conditions led to the broad rally. Year-ahead inflation expectations plummeted from 6.6% last month, to 5.1%.

Weekly Market Recap — Global Equities Fall as Geopolitical Tensions Increase

Equities:

The MSCI AC World Index was lower for the first time in three weeks amid increased geopolitical tensions. Major U.S. averages were mostly higher through Thursday’s trading, but sentiment quickly deteriorated on Friday after reports of Israel launching airstrikes in Iran. Small-cap averages underperformed on a relative basis. The Dow Jones Industrial Average fell back into negative territory for the year.

Fixed Income:

The Bloomberg Aggregate Index was higher last week as yields broadly declined after last week’s economic data (bond prices higher). The US 10-year note auction showed strong demand last week as well, increasing sentiment around the market despite fiscal policy concerns. All sectors of fixed income were higher as yields fell.

Commodities/FX:

The Bloomberg Commodity Index was higher for the second straight week. Crude oil prices posted their best return since October 2022 as geopolitical tensions between Israel and Iran caused investors to grow concernd about potential supply disruptions. Gold prices rallied as investors flocked to the safe-haven amid the escalation in tensions.


Price Stability fed's dual mandates


Data is as of June 2025.
Source: FactSet Research Systems, Verdence Capital Advisors

Disclaimer: © Verdence Capital Advisors, LLC

Reproduction without permission is not permitted. The indexes presented are unmanaged portfolios of specified securities and do not reflect any initial or ongoing expenses nor can it be invested in directly. An investment’s portfolio may differ significantly from the securities in the index.  This material was prepared by Verdence Capital Advisors, LLC (“VCA” or “we”, “our”, “us”). VCA believes the information and data in this document were obtained from sources considered reliable and correct and cannot guarantee either their accuracy or completeness. VCA has not independently verified third-party sourced information and data. Any projections, outlooks or assumptions should not be construed to be indicative of the actual events which will occur. These projections, market outlooks or estimates are subject to change without notice. This material is being provided for informational purposes only and is not intended to provide, and should not be relied upon for, investment, accounting, legal, or tax advice. Past performance is not a guarantee of future results. Different types of investments involve varying degrees of risk, and there can be no assurance that the future performance of any specific investment, investment strategy, or product or any non-investment related content, made reference to directly or indirectly in these materials will be profitable, equal any corresponding indicated historical performance level(s), be suitable for your portfolio or individual situation, or prove successful. You should not assume that any discussion or information contained in this report serves as the receipt of, or as a substitute for, personalized investment advice from VCA. Alternative investments are designed only for sophisticated investors who are able to bear the risk of the loss of their entire investment. Investing in alternative investments should be viewed as illiquid and generally not readily marketable or transferable. Investors should be prepared to bear the financial risks of investing in an alternative investment for an indefinite period of time. Due to various factors, including changing market conditions and/or applicable laws, the content may no longer be reflective of current opinions or positions. All indexes are unmanaged, and you cannot invest directly in an index. Index returns do not include fees or expenses. Sector Watch Use of this website is intended for U.S. residents only. Any recommendation, opinion or advice regarding securities or markets contained in such material does not reflect the views of Verdence Capital, and Verdence Capital does not verify any information included in such material. Verdence Capital assumes no responsibility for any fact, recommendation, opinion, or advice contained in any such research material and expressly disclaims any responsibility for any decisions or for the suitability of any security or transaction based on it. Any decisions you may make to buy, sell, or hold a security based on this research will be entirely your own and not in any way deemed to be endorsed or influenced by or attributed to Verdence Capital. It is understood that, without exception, any order based on such research that is placed for execution is and will be treated as an UNRECOMMENDED AND UNSOLICITED ORDER. Further, Verdence Capital assumes no responsibility for the accuracy, completeness, or timeliness of any such research or for updating such research, which is subject to change without notice at any time. Verdence Capital does not provide tax, or legal advice. Under no circumstance is the information contained within this research to be used or considered as an offer to sell or a solicitation of an offer to buy any particular investment/security. Fixed income securities are subject to increased loss of principal during periods of rising interest rates. Fixed income investments are subject to various other risks including changes in credit quality, market valuations, liquidity, prepayments, early redemption, corporate events, tax ramifications and other factors. Lower rated securities are subject to greater credit risk, default risk, and liquidity risk. Commodity‐related products, including futures, carry a high level of risk and are not suitable for all investors. Commodity‐related products may be extremely volatile, illiquid and can be significantly affected by underlying commodity prices, world events, import controls, worldwide competition, government regulations, and economic conditions, regardless of the length of time shares are held. Data is provided for information purposes only and is not intended for trading purposes. Verdence Capital shall not be liable for any errors or delay in the content, or for any action taken in reliance on any content. Weekly Insights/Qtrly & Annual Outlook The indexes presented are unmanaged portfolios of specified securities and do not reflect any initial or ongoing expenses nor can it be invested in directly. An investment’s portfolio may differ significantly from the securities in the index. Semi-Annual Chart Pack Where shown, performance information presented is that which has been calculated and presented by an unaffiliated third-party manager. We have no insight into the performance of the advisor/product/account or fund shown and do not attempt to determine whether the performance presented is accurate. Therefore, the performance could be incorrect, overstated or not reflective of actual trading of client funds. There is the potential that the performance shown is a back test and not the result of real investment advice and trading. As such, it could not be relied upon as indicative of future returns of a particular strategy. Where performance shown is that of a pooled account, limited partnership, or private equity fund, you should be aware that there is a significant lack of transparency into the operations and investment process and investment vehicles invested in. As a result, pricing and valuation of the underlying holdings which produced the stated performance could be incorrect, stale, or overstated and therefore the performance figures presented cannot be relied upon. Before investing, we encourage you to request additional information, particularly performance information, of any product that you are considering for your client. You should read, as applicable, the Prospectus, SAI, Composite Disclosure and/or performance disclosure associated with any product that you are considering for investment for your or your client’s. Products shown may have minimum account sizes or minimum investments which may preclude retail and non-high net worth investors from being able to invest in these products. You should be aware that certain LPs may be closed to new investors and therefore your clients may be prevented from investing in these products. Portfolio Implementation and Rationales The SMA Asset Allocation Models do not represent a personalized recommendation of a particular investment strategy to you or your clients. You should not buy or sell an investment without first considering whether it is appropriate for your client’s portfolio. Additionally, you should review and consider any recent market news. All expressions of opinion are subject to change without notice in reaction to shifting market conditions. Data contained herein from third-party providers is obtained from what are considered reliable sources. However, its accuracy, completeness or reliability cannot be guaranteed. Supporting documentation for any claims or statistical information is available upon request. Examples provided are for illustrative purposes only and not intended to be reflective of results you can expect to achieve. Diversification and asset allocation do not ensure a profit and do not protect against losses in declining markets. Any forecasts contained herein are for illustrative purposes only, may be based upon proprietary research and are developed through analysis of historical public data. Investments in growth stocks may experience price volatility due to their sensitivity to market fluctuations and dependence on future earnings expectations. Sector allocation references to market capitalization (“smid cap” or “micro caps” etc.) may be subject to special risks given their characteristic narrow markets, limited financial resources, and less liquid stocks, all of which may cause price volatility. International/global investing can involve special risks, such as political changes and currency fluctuations. These risks are heightened in emerging markets. A significant percentage of the underlying investments in aggressive asset allocation portfolio investments have a higher-than-average risk exposure. You should consider your risk tolerance of each of your clients carefully before choosing such a strategy. An investment with multiple underlying investments (which may include asset-allocation or custom blended investments) may be subject to the expenses of those underlying investments in addition to those of the investment itself. Investments may reside in the specialty category due to 1) allowable investment flexibility that precludes classification in standard asset categories and/or 2) investment concentration in a limited group of securities or industry sectors. Investments in this category may be more volatile than less flexible and/or less concentrated investments and may be appropriate as only a minor component in an investor’s overall portfolio. Investment Managers You and your clients should carefully consider investment objectives, risks, charges, and expenses of Funds discussed. This and other important information are contained in the respective Fund prospectuses and summary prospectuses, which should be read carefully before investing. Investment portfolio statistics change over time. Current performance may be lower or higher than return data quoted herein. The investment return and the principal value of an investment will fluctuate; so, an investor’s shares/units, when redeemed, may be worth more or less than their original cost. Verdence relies heavily on unaudited third-party data. Data sources include public data, such as mutual fund data, and non-public data, such as information provided by other investment advisors and managers of limited partnership pooled accounts. Data and/or statistics included on this Portal, including references to performance, opinions, ratings, rankings, manager statistics and demographic information, product, or strategy descriptions, either quantitative or qualitative, are based upon information reasonably available to us as of the applicable date(s) then-published. Information has been obtained from sources that we believe to be reliable, but these sources cannot be guaranteed as to their accuracy or completeness. All data and information produced by a third party has the potential to be incorrect, incomplete, or otherwise misleading. No implication shall be created that the information contained on the Site is correct, including as of any time subsequent to the publish date, and Verdence does not undertake an obligation to update such information at any time after such date. Verdence makes not warranty or representation of the veracity of the data and information and its use of the information should not be implied as an endorsement of any material or statements made. Data, particularly non-public data, is subject to error and where the information is not audited, the potential for error is greater. Where shown, performance information presented is that which has been calculated and presented by an unaffiliated third-party manager. We have no insight into the performance of the advisor/product/account or fund shown and do not attempt to determine whether the performance presented is accurate. Therefore, the performance could be incorrect, overstated or not reflective of actual trading of client funds. There is the potential that the performance shown is a back test and not the result of real investment advice and trading. As such, it could not be relied upon as indicative of future returns of a particular strategy. Where performance shown is that of a pooled account, limited partnership, or private equity fund, you should be aware that there is a significant lack of transparency into the operations and investment process and investment vehicles invested in. As a result, pricing and valuation of the underlying holdings which produced the stated performance could be incorrect, stale, or overstated and therefore the performance figures presented cannot be relied upon. Before investing, we encourage you to request additional information, particularly performance information, of any product that you are considering for your client. You should read, as applicable, the Prospectus, SAI, Composite Disclosure and/or performance disclosure associated with any product that you are considering for investment for your or your client’s. Certain products shown may have account minimums or minimum investment sizes that are unattainable for your clients and therefore they may not be eligible to invest in these products. Reference to registration with the Securities and Exchange Commission (“SEC”) does not imply that the SEC has endorsed or approved the qualifications of Verdence or its respective representatives to provide any advisory services described on the Site.

Read more