WEEKLY INSIGHTS

February 18, 2025
Download PDF

Key Takeaways:

  • Five years since COVID sent stocks into bear market.
  • Global economy starting to pay the price.
  • S. labor market nearing equilibrium.
  • Deficits are out of control.
  • Challenges unlikely gone for good.
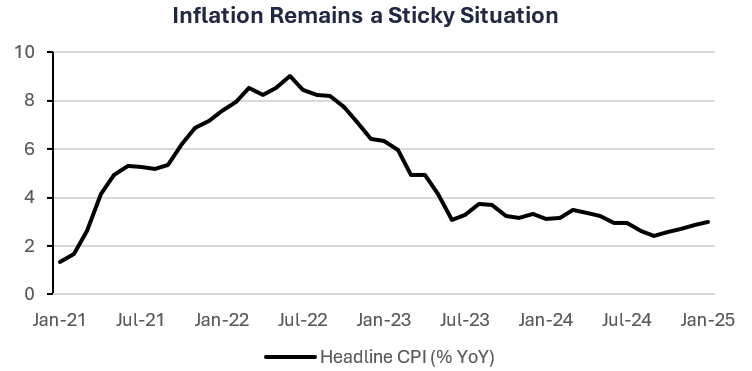
  • Inflation trends since COVID pandemic

Five Years Since COVID Bear Market

Five years ago this week, the S&P 500 started to stumble into a short but painful bear market as the COVID crisis worsened. Fast forward to 2025. The global economy is still dealing with some of the negative ramifications of the actions that governments took in response to COVID. While economists will study the long term effects for decades, we want to take a look at inflation trends since COVID pandemic, and the economic impact five years later.

  • S. labor market finally near equilibrium: The pandemic damaged the U.S. labor market for years. Early retirements, health fears and government stimulus kept Americans out of the workforce. This occurred at a time when the world began to reopen. And the pent-up consumer demand was met with a tight labor force. At the peak, there were 12 million job openings for the six million unemployed Americans. As of January 2025, that imbalance was nearly normalized with 6.9 million unemployed and 7.6 million job openings. The labor force participation rate has improved from the lowest level since 1973 during the pandemic but remains below the historical average.
  • Inflation has been a residual challenge: Central bank error and excessive spending pushed inflation to multi-decade highs. In the U.S., the Fed started (albeit late) an aggressive tightening cycle and brought inflation lower (CPI peaked at 9.1% and is currently 3.0%) but their progress has stalled in recent months. In addition, the Fed has little control over some of the sticky areas of inflation (e.g., housing). Not even the Fed expects the U.S. to see their target inflation rate (2.0%) until 2027.
  • The bill continues to grow: Governments around the world paid a hefty price tag to keep their economies from collapsing during COVID. Global government debt has surged to $102 trillion from $60 trillion 10 years ago (~100% of global GDP).1 However, global GDP only grew $40 trillion over the past 10 years.2 In the U.S., a burgeoning deficit and higher interest rates have worsened the government’s balance sheet. Net interest costs have almost tripled since 2020, and the U.S. is paying more for interest on their debt than Medicare or defense.3
  • Consumers still hurting: The net worth of American households has increased by $55 trillion since 1Q20. This has been primarily led by the surge in asset prices (e.g. stocks, housing). Americans have faced continued challenges since the pandemic (especially those that do not own a home or investments). Inflation on items like food, energy and insurance are surging more than wages. Homeowner affordability is hovering near a record low. Credit card debt is at a record high. Confidence has deteriorated. The COVID stimulus has been long gone and savings are depleted.

The Bottom Line:

It is hard to believe it has been five years since the COVID pandemic began. Economic growth has been resilient due to government support and a euphoric consumer. But the negative ramifications are unlikely to disappear anytime soon. There has been a structural change in interest rates and inflation that needs to be absorbed by companies and consumers. Unfortunately, this will likely come at the expense of growth.

Your Economic and Market Detailed Recaps

  • Small business optimism falls for first time in five months.
  • Headline CPI increases more than expected.
  • Consumers slow their pace of spending.
  • Tech leads global equity rally.
  • Yields relatively unchanged; Municipal bonds underperform.
  • Natural gas prices higher on frigid weather outlook.

Weekly Economic Recap — Inflation Picks Up

Small business optimism decreased for the first time in five months in January. Capital spending plans fell at the steepest monthly pace since 1995. The uncertainty indicator increased by the most since 1986 (14 pts.), matching the third-highest level on record.

Inflation as tracked by the Consumer Price Index increased more than expected in January (3.0% vs. 2.9% est. year over year). Shelter costs continued to be a problem as the gauge increased 0.4% for the month and accounted for ~30% of the headline increase. Egg prices increased by the most since June 2015 driven by the avian bird flu outbreak. Core inflation, which excludes volatile food and energy prices, increased more than expected driven by higher prices for car insurance and airfares. Prescription drug prices increased at the fastest pace on record.

Wholesale prices as tracked by the Producer Price Index increased slightly more than expected in January (0.4% vs. 0.3% est. month over month) driven by higher food and energy costs. Diesel fuel costs surged 10.4% in January and egg prices climbed 44% on a monthly basis, and more than 185% on an annualized basis.

Retail sales were sharply lower than expected in January (-0.9% vs. -0.2% est. month over month) and posted the largest monthly drop in two years. Nine of the thirteen categories indicated lower sales, with the largest decline coming from motor vehicles. The control group, which strips out volatile prices and filters into the government’s calculation of spending for GDP, decreased by the most since March 2023 (-0.8%).

The U.S. federal budget gap widened to a record $840 billion over the first third of the fiscal year. Interest costs on federal debt continued to be a key driver to the deficit, as costs hit $392 billion in the period.

Weekly Market Recap — Global Equities Rally on Hopes of Less Severe Trump Tariffs

Equities: The MSCI AC World Index was higher for the second straight week. Global equities rallied on hopes Trump’s reciprocal tariff plans may not be as severe as believed. China equities led global market performance last week as investors bought up AI names, leading the Hang Seng Index to post its best return (in USD) since October 2024. Tech also outperformed in the U.S. as the Nasdaq Composite Index posted its best return since December.

Fixed Income: The Bloomberg Aggregate Index was higher for the fifth straight week. Treasury yields were volatile during the week as hotter-than-expected CPI data spooked investors, but hopes of Trump’s reciprocal tariff plans caused yields to finish the week relatively unchanged. Municipal bonds were lower for the first time in five weeks as volatility in longer-data yields put downward pressure on the market.

Commodities/FX: The Bloomberg Commodity Index was higher for the second straight week. Copper prices were higher for the second straight week as optimism around China stimulus continued. Fears of Trump tariffs on copper also drove the price higher. Natural gas prices were higher as frigid weather continues to drive demand higher for heating oil.


chart of inflation since covid


Data is as of January 2025.
Source: FactSet Research Systems, Verdence Capital Advisors

Disclaimer: © Verdence Capital Advisors, LLC

Reproduction without permission is not permitted. The indexes presented are unmanaged portfolios of specified securities and do not reflect any initial or ongoing expenses nor can it be invested in directly. An investment’s portfolio may differ significantly from the securities in the index.  This material was prepared by Verdence Capital Advisors, LLC (“VCA” or “we”, “our”, “us”). VCA believes the information and data in this document were obtained from sources considered reliable and correct and cannot guarantee either their accuracy or completeness. VCA has not independently verified third-party sourced information and data. Any projections, outlooks or assumptions should not be construed to be indicative of the actual events which will occur. These projections, market outlooks or estimates are subject to change without notice. This material is being provided for informational purposes only and is not intended to provide, and should not be relied upon for, investment, accounting, legal, or tax advice. Past performance is not a guarantee of future results. Different types of investments involve varying degrees of risk, and there can be no assurance that the future performance of any specific investment, investment strategy, or product or any non-investment related content, made reference to directly or indirectly in these materials will be profitable, equal any corresponding indicated historical performance level(s), be suitable for your portfolio or individual situation, or prove successful. You should not assume that any discussion or information contained in this report serves as the receipt of, or as a substitute for, personalized investment advice from VCA. Alternative investments are designed only for sophisticated investors who are able to bear the risk of the loss of their entire investment. Investing in alternative investments should be viewed as illiquid and generally not readily marketable or transferable. Investors should be prepared to bear the financial risks of investing in an alternative investment for an indefinite period of time. Due to various factors, including changing market conditions and/or applicable laws, the content may no longer be reflective of current opinions or positions. All indexes are unmanaged, and you cannot invest directly in an index. Index returns do not include fees or expenses. Sector Watch Use of this website is intended for U.S. residents only. Any recommendation, opinion or advice regarding securities or markets contained in such material does not reflect the views of Verdence Capital, and Verdence Capital does not verify any information included in such material. Verdence Capital assumes no responsibility for any fact, recommendation, opinion, or advice contained in any such research material and expressly disclaims any responsibility for any decisions or for the suitability of any security or transaction based on it. Any decisions you may make to buy, sell, or hold a security based on this research will be entirely your own and not in any way deemed to be endorsed or influenced by or attributed to Verdence Capital. It is understood that, without exception, any order based on such research that is placed for execution is and will be treated as an UNRECOMMENDED AND UNSOLICITED ORDER. Further, Verdence Capital assumes no responsibility for the accuracy, completeness, or timeliness of any such research or for updating such research, which is subject to change without notice at any time. Verdence Capital does not provide tax, or legal advice. Under no circumstance is the information contained within this research to be used or considered as an offer to sell or a solicitation of an offer to buy any particular investment/security. Fixed income securities are subject to increased loss of principal during periods of rising interest rates. Fixed income investments are subject to various other risks including changes in credit quality, market valuations, liquidity, prepayments, early redemption, corporate events, tax ramifications and other factors. Lower rated securities are subject to greater credit risk, default risk, and liquidity risk. Commodity‐related products, including futures, carry a high level of risk and are not suitable for all investors. Commodity‐related products may be extremely volatile, illiquid and can be significantly affected by underlying commodity prices, world events, import controls, worldwide competition, government regulations, and economic conditions, regardless of the length of time shares are held. Data is provided for information purposes only and is not intended for trading purposes. Verdence Capital shall not be liable for any errors or delay in the content, or for any action taken in reliance on any content. Weekly Insights/Qtrly & Annual Outlook The indexes presented are unmanaged portfolios of specified securities and do not reflect any initial or ongoing expenses nor can it be invested in directly. An investment’s portfolio may differ significantly from the securities in the index. Semi-Annual Chart Pack Where shown, performance information presented is that which has been calculated and presented by an unaffiliated third-party manager. We have no insight into the performance of the advisor/product/account or fund shown and do not attempt to determine whether the performance presented is accurate. Therefore, the performance could be incorrect, overstated or not reflective of actual trading of client funds. There is the potential that the performance shown is a back test and not the result of real investment advice and trading. As such, it could not be relied upon as indicative of future returns of a particular strategy. Where performance shown is that of a pooled account, limited partnership, or private equity fund, you should be aware that there is a significant lack of transparency into the operations and investment process and investment vehicles invested in. As a result, pricing and valuation of the underlying holdings which produced the stated performance could be incorrect, stale, or overstated and therefore the performance figures presented cannot be relied upon. Before investing, we encourage you to request additional information, particularly performance information, of any product that you are considering for your client. You should read, as applicable, the Prospectus, SAI, Composite Disclosure and/or performance disclosure associated with any product that you are considering for investment for your or your client’s. Products shown may have minimum account sizes or minimum investments which may preclude retail and non-high net worth investors from being able to invest in these products. You should be aware that certain LPs may be closed to new investors and therefore your clients may be prevented from investing in these products. Portfolio Implementation and Rationales The SMA Asset Allocation Models do not represent a personalized recommendation of a particular investment strategy to you or your clients. You should not buy or sell an investment without first considering whether it is appropriate for your client’s portfolio. Additionally, you should review and consider any recent market news. All expressions of opinion are subject to change without notice in reaction to shifting market conditions. Data contained herein from third-party providers is obtained from what are considered reliable sources. However, its accuracy, completeness or reliability cannot be guaranteed. Supporting documentation for any claims or statistical information is available upon request. Examples provided are for illustrative purposes only and not intended to be reflective of results you can expect to achieve. Diversification and asset allocation do not ensure a profit and do not protect against losses in declining markets. Any forecasts contained herein are for illustrative purposes only, may be based upon proprietary research and are developed through analysis of historical public data. Investments in growth stocks may experience price volatility due to their sensitivity to market fluctuations and dependence on future earnings expectations. Sector allocation references to market capitalization (“smid cap” or “micro caps” etc.) may be subject to special risks given their characteristic narrow markets, limited financial resources, and less liquid stocks, all of which may cause price volatility. International/global investing can involve special risks, such as political changes and currency fluctuations. These risks are heightened in emerging markets. A significant percentage of the underlying investments in aggressive asset allocation portfolio investments have a higher-than-average risk exposure. You should consider your risk tolerance of each of your clients carefully before choosing such a strategy. An investment with multiple underlying investments (which may include asset-allocation or custom blended investments) may be subject to the expenses of those underlying investments in addition to those of the investment itself. Investments may reside in the specialty category due to 1) allowable investment flexibility that precludes classification in standard asset categories and/or 2) investment concentration in a limited group of securities or industry sectors. Investments in this category may be more volatile than less flexible and/or less concentrated investments and may be appropriate as only a minor component in an investor’s overall portfolio. Investment Managers You and your clients should carefully consider investment objectives, risks, charges, and expenses of Funds discussed. This and other important information are contained in the respective Fund prospectuses and summary prospectuses, which should be read carefully before investing. Investment portfolio statistics change over time. Current performance may be lower or higher than return data quoted herein. The investment return and the principal value of an investment will fluctuate; so, an investor’s shares/units, when redeemed, may be worth more or less than their original cost. Verdence relies heavily on unaudited third-party data. Data sources include public data, such as mutual fund data, and non-public data, such as information provided by other investment advisors and managers of limited partnership pooled accounts. Data and/or statistics included on this Portal, including references to performance, opinions, ratings, rankings, manager statistics and demographic information, product, or strategy descriptions, either quantitative or qualitative, are based upon information reasonably available to us as of the applicable date(s) then-published. Information has been obtained from sources that we believe to be reliable, but these sources cannot be guaranteed as to their accuracy or completeness. All data and information produced by a third party has the potential to be incorrect, incomplete, or otherwise misleading. No implication shall be created that the information contained on the Site is correct, including as of any time subsequent to the publish date, and Verdence does not undertake an obligation to update such information at any time after such date. Verdence makes not warranty or representation of the veracity of the data and information and its use of the information should not be implied as an endorsement of any material or statements made. Data, particularly non-public data, is subject to error and where the information is not audited, the potential for error is greater. Where shown, performance information presented is that which has been calculated and presented by an unaffiliated third-party manager. We have no insight into the performance of the advisor/product/account or fund shown and do not attempt to determine whether the performance presented is accurate. Therefore, the performance could be incorrect, overstated or not reflective of actual trading of client funds. There is the potential that the performance shown is a back test and not the result of real investment advice and trading. As such, it could not be relied upon as indicative of future returns of a particular strategy. Where performance shown is that of a pooled account, limited partnership, or private equity fund, you should be aware that there is a significant lack of transparency into the operations and investment process and investment vehicles invested in. As a result, pricing and valuation of the underlying holdings which produced the stated performance could be incorrect, stale, or overstated and therefore the performance figures presented cannot be relied upon. Before investing, we encourage you to request additional information, particularly performance information, of any product that you are considering for your client. You should read, as applicable, the Prospectus, SAI, Composite Disclosure and/or performance disclosure associated with any product that you are considering for investment for your or your client’s. Certain products shown may have account minimums or minimum investment sizes that are unattainable for your clients and therefore they may not be eligible to invest in these products. Reference to registration with the Securities and Exchange Commission (“SEC”) does not imply that the SEC has endorsed or approved the qualifications of Verdence or its respective representatives to provide any advisory services described on the Site.

Read more