WEEKLY INSIGHTS

January 21, 2025
Download PDF

Key Takeaways:

  • U.S. Treasuries continue to rise as we come into 2025.
  • Investors repricing expectations for number of Fed rate cuts.
  • Inflation concerns fuel the selloff in yields.
  • A tough road ahead of housing with mortgage rates rising.
  • Yield volatility to remain heightened.

Understanding the Treasury Market Selloff

While bond investors were offered some reprieve last week, U.S. Treasury yields have risen in 2025 with the 10 YR U.S. Treasury yield climbing to the highest level since October 2023 and the 30 YR yield crossing above the psychological 5.0% level. The rise has been led by long term rates. This has resulted in a normalization of the yield curve (the difference between short and long term rates). In this weekly, we address the reasons behind the move higher in long term interest rates and what it means for the economy and equity markets.

  • Repricing Fed rate cuts: With the U.S. economy remaining resilient and inflation proving stubborn, investors have been repricing the timing and magnitude of future rate cuts. Currently, the Fed funds futures market is pricing in one to maybe two rate cuts in 2025. This is less than the four to six that were priced in just four months ago. This has led to what is called a bear steepening of the yield curve, a phenomenon where long-term rates rise faster (due to a rise in long-term inflation expectations) than short-term rates (past and future rate cuts are priced in).
  • Inflation expectations are rising: Long term inflation expectations in not only the bond market but also by consumers have been surging. For example, the 10YR breakeven inflation rate in the Treasury market (the difference between nominal yields and real yields) has increased to the highest level since March 2023. In addition, 5–10-year inflation expectations in the University of Michigan Consumer Confidence Index rose to the highest level since 2008 (3.3%).
  • Market prepares for Trump 2.0: Investors are preparing for what Trump 2.0 policies may look like. Some key economic policies revolve around tariffs, extending tax cuts, and deportations. Many economists believe these policies carry an upside risk to inflation and a rising deficit.
  • Bad news for housing: The mortgage rate is priced off long term rates not the Fed funds rate. Unfortunately, the 30-year mortgage rate has climbed along with the rise in long-term Treasury yields. The 30-year mortgage is above 7.0% and it is the highest level since May 2024.
  • Financials mixed: The financial sector could benefit from better net interest margins as the yield curve normalizes and they can earn more on loans. However, higher long-term rates are a headwind for small and regional banks as risks in the real estate (commercial and residential) and consumer loan market increase.
  • Expensive equities at risk: Those areas of the equity market with high price to earnings multiples (technology, growth) are sensitive to a rise in yields. Therefore, we expect volatility in technology, communication services and discretionary sectors.

The Bottom Line:

It is rare that the Fed starts cutting rates and the 10 YR Treasury yield rises (10YR yield is almost 100 bps higher since the Fed cut in September 2024). This highlights how inflation is still a concern. We may have seen a near term peak in 10 and 30-year yields but investors should be accustomed to ongong volatility and invest in bonds in a defensive manner (intermediate maturing bonds).

Your Economic and Market Detailed Recaps

  • Small business optimism highest since Oct. 2018.
  • Core CPI increases at slowest pace since July 2024.
  • Consumers expect inflation to be stubborn.
  • Rate sensitive equities lead global rally.
  • Treasury yields fall as investors assess economic data.
  • Commodities post fourth straight week of gains.

Weekly Economic Recap — Inflation data slows but consumers not convinced

Small business optimism increased to the highest level since October 2018 as expectations over favorable Trump economic policies surged. Owners are expecting better business conditions as that component increased to the highest level since 2002. Sales expectations increased to the highest since January 2020.

Wholesale inflation unexpectedly eased on a monthly basis in December as the Producer Price Index increased less than expected (0.2% vs. 0.4% estimate). Food costs fell 0.1% led by a 15% decline in vegetables.

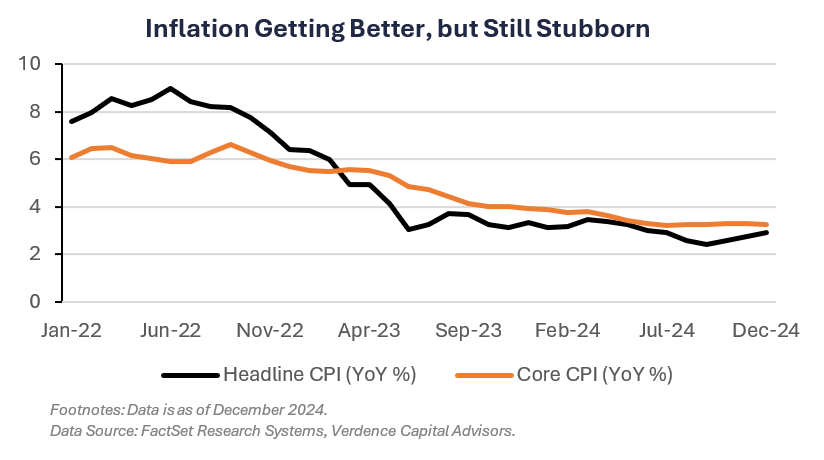
Headline inflation, as tracked by the Consumer Price Index, increased roughly in line with consensus estimates in December at 2.9% YoY. Energy prices, specifically gasoline prices, contributed the most to the headline increase in inflation. Shelter prices posted the smallest one-year gain since January 2022 (4.6%). Core inflation, which excludes volatile food and energy prices, increased at the slowest pace since July 2024 (3.2%) and was slightly less than consensus estimates.

The New York Fed Survey showed consumers expect higher inflation over the next three-years, increasing expectations to 3.0% in December (from 2.6% in November). Labor market expectations were broadly weaker, as confidence to find a new position in the event of a job loss fell to the lowest level since April 2021 (50.2%).

U.S. retail sales increased in December by slighly less than consensus estimates (0.4% vs. 0.6% est.). Spending at gasoline stations increased the most since April 2024. The control group, which excludes various volatile items, increased at the fastest pace in three months (0.7%).
.

Weekly Market Recap — Global Equities Rally as Investors Prepare for Trump Presidency; Yields Tumble

Equities: The MSCI AC World Index was higher for the first time in three weeks. U.S. equity markets led the gains and were higher for the first time in 2025 as investors prepared for President Trump’s inaguration in hopes of deregulation and lower taxes. Rate sensitive areas of the market, including small-caps and technology, led the gains as the rise in Treasury yields subsided.

Fixed Income: The Bloomberg Aggregate Index was higher last week as Treasury yields moved lower. The U.S. 10YR Treasury note finished the week ~13bps lower (at 4.63%) as investors digested inflation data and its implications on Fed policy. All areas of fixed income markets were higher led by investment grade corporate bonds.

Commodities/FX: The Bloomberg Commodity Index was higher for the fourth straight week. Crude oil prices notched their fourth straight week of gains as U.S. sanctions threaten global supply. Gold prices were higher for the third straight week as investors prepared for President Trump to take office. Bitcoin prices topped $100,000 level as investors expect Trump to release crypto-positive initiatives.


graph of Inflation Getting Better, but Still Stubborn


Data is as of December 2024.
Source: FactSet Research Systems, Verdence Capital Advisors

Disclaimer: © Verdence Capital Advisors, LLC

Reproduction without permission is not permitted. The indexes presented are unmanaged portfolios of specified securities and do not reflect any initial or ongoing expenses nor can it be invested in directly. An investment’s portfolio may differ significantly from the securities in the index.  This material was prepared by Verdence Capital Advisors, LLC (“VCA” or “we”, “our”, “us”). VCA believes the information and data in this document were obtained from sources considered reliable and correct and cannot guarantee either their accuracy or completeness. VCA has not independently verified third-party sourced information and data. Any projections, outlooks or assumptions should not be construed to be indicative of the actual events which will occur. These projections, market outlooks or estimates are subject to change without notice. This material is being provided for informational purposes only and is not intended to provide, and should not be relied upon for, investment, accounting, legal, or tax advice. Past performance is not a guarantee of future results. Different types of investments involve varying degrees of risk, and there can be no assurance that the future performance of any specific investment, investment strategy, or product or any non-investment related content, made reference to directly or indirectly in these materials will be profitable, equal any corresponding indicated historical performance level(s), be suitable for your portfolio or individual situation, or prove successful. You should not assume that any discussion or information contained in this report serves as the receipt of, or as a substitute for, personalized investment advice from VCA. Alternative investments are designed only for sophisticated investors who are able to bear the risk of the loss of their entire investment. Investing in alternative investments should be viewed as illiquid and generally not readily marketable or transferable. Investors should be prepared to bear the financial risks of investing in an alternative investment for an indefinite period of time. Due to various factors, including changing market conditions and/or applicable laws, the content may no longer be reflective of current opinions or positions. All indexes are unmanaged, and you cannot invest directly in an index. Index returns do not include fees or expenses. Sector Watch Use of this website is intended for U.S. residents only. Any recommendation, opinion or advice regarding securities or markets contained in such material does not reflect the views of Verdence Capital, and Verdence Capital does not verify any information included in such material. Verdence Capital assumes no responsibility for any fact, recommendation, opinion, or advice contained in any such research material and expressly disclaims any responsibility for any decisions or for the suitability of any security or transaction based on it. Any decisions you may make to buy, sell, or hold a security based on this research will be entirely your own and not in any way deemed to be endorsed or influenced by or attributed to Verdence Capital. It is understood that, without exception, any order based on such research that is placed for execution is and will be treated as an UNRECOMMENDED AND UNSOLICITED ORDER. Further, Verdence Capital assumes no responsibility for the accuracy, completeness, or timeliness of any such research or for updating such research, which is subject to change without notice at any time. Verdence Capital does not provide tax, or legal advice. Under no circumstance is the information contained within this research to be used or considered as an offer to sell or a solicitation of an offer to buy any particular investment/security. Fixed income securities are subject to increased loss of principal during periods of rising interest rates. Fixed income investments are subject to various other risks including changes in credit quality, market valuations, liquidity, prepayments, early redemption, corporate events, tax ramifications and other factors. Lower rated securities are subject to greater credit risk, default risk, and liquidity risk. Commodity‐related products, including futures, carry a high level of risk and are not suitable for all investors. Commodity‐related products may be extremely volatile, illiquid and can be significantly affected by underlying commodity prices, world events, import controls, worldwide competition, government regulations, and economic conditions, regardless of the length of time shares are held. Data is provided for information purposes only and is not intended for trading purposes. Verdence Capital shall not be liable for any errors or delay in the content, or for any action taken in reliance on any content. Weekly Insights/Qtrly & Annual Outlook The indexes presented are unmanaged portfolios of specified securities and do not reflect any initial or ongoing expenses nor can it be invested in directly. An investment’s portfolio may differ significantly from the securities in the index. Semi-Annual Chart Pack Where shown, performance information presented is that which has been calculated and presented by an unaffiliated third-party manager. We have no insight into the performance of the advisor/product/account or fund shown and do not attempt to determine whether the performance presented is accurate. Therefore, the performance could be incorrect, overstated or not reflective of actual trading of client funds. There is the potential that the performance shown is a back test and not the result of real investment advice and trading. As such, it could not be relied upon as indicative of future returns of a particular strategy. Where performance shown is that of a pooled account, limited partnership, or private equity fund, you should be aware that there is a significant lack of transparency into the operations and investment process and investment vehicles invested in. As a result, pricing and valuation of the underlying holdings which produced the stated performance could be incorrect, stale, or overstated and therefore the performance figures presented cannot be relied upon. Before investing, we encourage you to request additional information, particularly performance information, of any product that you are considering for your client. You should read, as applicable, the Prospectus, SAI, Composite Disclosure and/or performance disclosure associated with any product that you are considering for investment for your or your client’s. Products shown may have minimum account sizes or minimum investments which may preclude retail and non-high net worth investors from being able to invest in these products. You should be aware that certain LPs may be closed to new investors and therefore your clients may be prevented from investing in these products. Portfolio Implementation and Rationales The SMA Asset Allocation Models do not represent a personalized recommendation of a particular investment strategy to you or your clients. You should not buy or sell an investment without first considering whether it is appropriate for your client’s portfolio. Additionally, you should review and consider any recent market news. All expressions of opinion are subject to change without notice in reaction to shifting market conditions. Data contained herein from third-party providers is obtained from what are considered reliable sources. However, its accuracy, completeness or reliability cannot be guaranteed. Supporting documentation for any claims or statistical information is available upon request. Examples provided are for illustrative purposes only and not intended to be reflective of results you can expect to achieve. Diversification and asset allocation do not ensure a profit and do not protect against losses in declining markets. Any forecasts contained herein are for illustrative purposes only, may be based upon proprietary research and are developed through analysis of historical public data. Investments in growth stocks may experience price volatility due to their sensitivity to market fluctuations and dependence on future earnings expectations. Sector allocation references to market capitalization (“smid cap” or “micro caps” etc.) may be subject to special risks given their characteristic narrow markets, limited financial resources, and less liquid stocks, all of which may cause price volatility. International/global investing can involve special risks, such as political changes and currency fluctuations. These risks are heightened in emerging markets. A significant percentage of the underlying investments in aggressive asset allocation portfolio investments have a higher-than-average risk exposure. You should consider your risk tolerance of each of your clients carefully before choosing such a strategy. An investment with multiple underlying investments (which may include asset-allocation or custom blended investments) may be subject to the expenses of those underlying investments in addition to those of the investment itself. Investments may reside in the specialty category due to 1) allowable investment flexibility that precludes classification in standard asset categories and/or 2) investment concentration in a limited group of securities or industry sectors. Investments in this category may be more volatile than less flexible and/or less concentrated investments and may be appropriate as only a minor component in an investor’s overall portfolio. Investment Managers You and your clients should carefully consider investment objectives, risks, charges, and expenses of Funds discussed. This and other important information are contained in the respective Fund prospectuses and summary prospectuses, which should be read carefully before investing. Investment portfolio statistics change over time. Current performance may be lower or higher than return data quoted herein. The investment return and the principal value of an investment will fluctuate; so, an investor’s shares/units, when redeemed, may be worth more or less than their original cost. Verdence relies heavily on unaudited third-party data. Data sources include public data, such as mutual fund data, and non-public data, such as information provided by other investment advisors and managers of limited partnership pooled accounts. Data and/or statistics included on this Portal, including references to performance, opinions, ratings, rankings, manager statistics and demographic information, product, or strategy descriptions, either quantitative or qualitative, are based upon information reasonably available to us as of the applicable date(s) then-published. Information has been obtained from sources that we believe to be reliable, but these sources cannot be guaranteed as to their accuracy or completeness. All data and information produced by a third party has the potential to be incorrect, incomplete, or otherwise misleading. No implication shall be created that the information contained on the Site is correct, including as of any time subsequent to the publish date, and Verdence does not undertake an obligation to update such information at any time after such date. Verdence makes not warranty or representation of the veracity of the data and information and its use of the information should not be implied as an endorsement of any material or statements made. Data, particularly non-public data, is subject to error and where the information is not audited, the potential for error is greater. Where shown, performance information presented is that which has been calculated and presented by an unaffiliated third-party manager. We have no insight into the performance of the advisor/product/account or fund shown and do not attempt to determine whether the performance presented is accurate. Therefore, the performance could be incorrect, overstated or not reflective of actual trading of client funds. There is the potential that the performance shown is a back test and not the result of real investment advice and trading. As such, it could not be relied upon as indicative of future returns of a particular strategy. Where performance shown is that of a pooled account, limited partnership, or private equity fund, you should be aware that there is a significant lack of transparency into the operations and investment process and investment vehicles invested in. As a result, pricing and valuation of the underlying holdings which produced the stated performance could be incorrect, stale, or overstated and therefore the performance figures presented cannot be relied upon. Before investing, we encourage you to request additional information, particularly performance information, of any product that you are considering for your client. You should read, as applicable, the Prospectus, SAI, Composite Disclosure and/or performance disclosure associated with any product that you are considering for investment for your or your client’s. Certain products shown may have account minimums or minimum investment sizes that are unattainable for your clients and therefore they may not be eligible to invest in these products. Reference to registration with the Securities and Exchange Commission (“SEC”) does not imply that the SEC has endorsed or approved the qualifications of Verdence or its respective representatives to provide any advisory services described on the Site.

Read more